
How Design Impacts ADR & Occupancy: The ROI Math Behind Great Interiors
If you’ve ever wondered why two nearly identical short-term rentals in the same neighborhood perform wildly differently, here’s the spoiler: design isn’t just “nice to have.” Design is performance. It’s pricing power. It’s conversion. It’s your five-star review engine. It is, quite literally, the difference between a listing that limps along and one that prints revenue.
In this guide, I’ll show you—plain English, no fluff—how good design moves your numbers: ADR (average daily rate), occupancy, RevPAR, and net profit. We’ll break down the math, cite reputable sources, and map your highest-leverage design plays so you can invest confidently and see a real return.
First, a quick KPI refresher (the scorecard your design influences)
ADR (Average Daily Rate) = Room revenue ÷ Nights sold.
Occupancy = Nights sold ÷ Nights available.
RevPAR (Revenue per Available Rental/Night) = ADR × Occupancy.
These are standard industry definitions used across STR and hotel analytics. If you’re newer to this, bookmark a reputable glossary so your team speaks the same language. (AirDNA)
Why start here? Because design touches all three. Better design yields stronger photos (higher click-through), better first impressions (higher conversion), clearer functionality (fewer friction points → better reviews), and more perceived value (price elasticity → higher ADR). Stack these together and your RevPAR lifts.

What the research says (and why it matters to hosts)
1) Reviews + reputation directly move ADR, occupancy, and RevPAR
One of the most cited hospitality studies from Cornell’s Center for Hospitality Research found that a 1-point increase in a hotel’s online review score (on a 5-point scale) lets the property raise price ~11.2% without losing market share. Translation: better reputation = more pricing power. This relationship flows through to occupancy and RevPAR as well. (Cornell Nolan)
Follow-on work summarizing the Cornell findings shows positive shifts in review scores are associated with increases in ADR, occupancy, and RevPAR—the exact trifecta you care about. In practice, design is one of the fastest levers for improving what guests actually rate: comfort, cleanliness perception, functionality, and overall “feel.” (Travel Weekly)
2) Market tailwinds: occupancy recovering, pricing power returning
On the macro side, the U.S. STR market stabilized through 2024, with occupancy edging up and ADR growth returning, setting up 2025 with healthier rate dynamics. That’s good news: design investments ride a rising tide. (AirDNA)
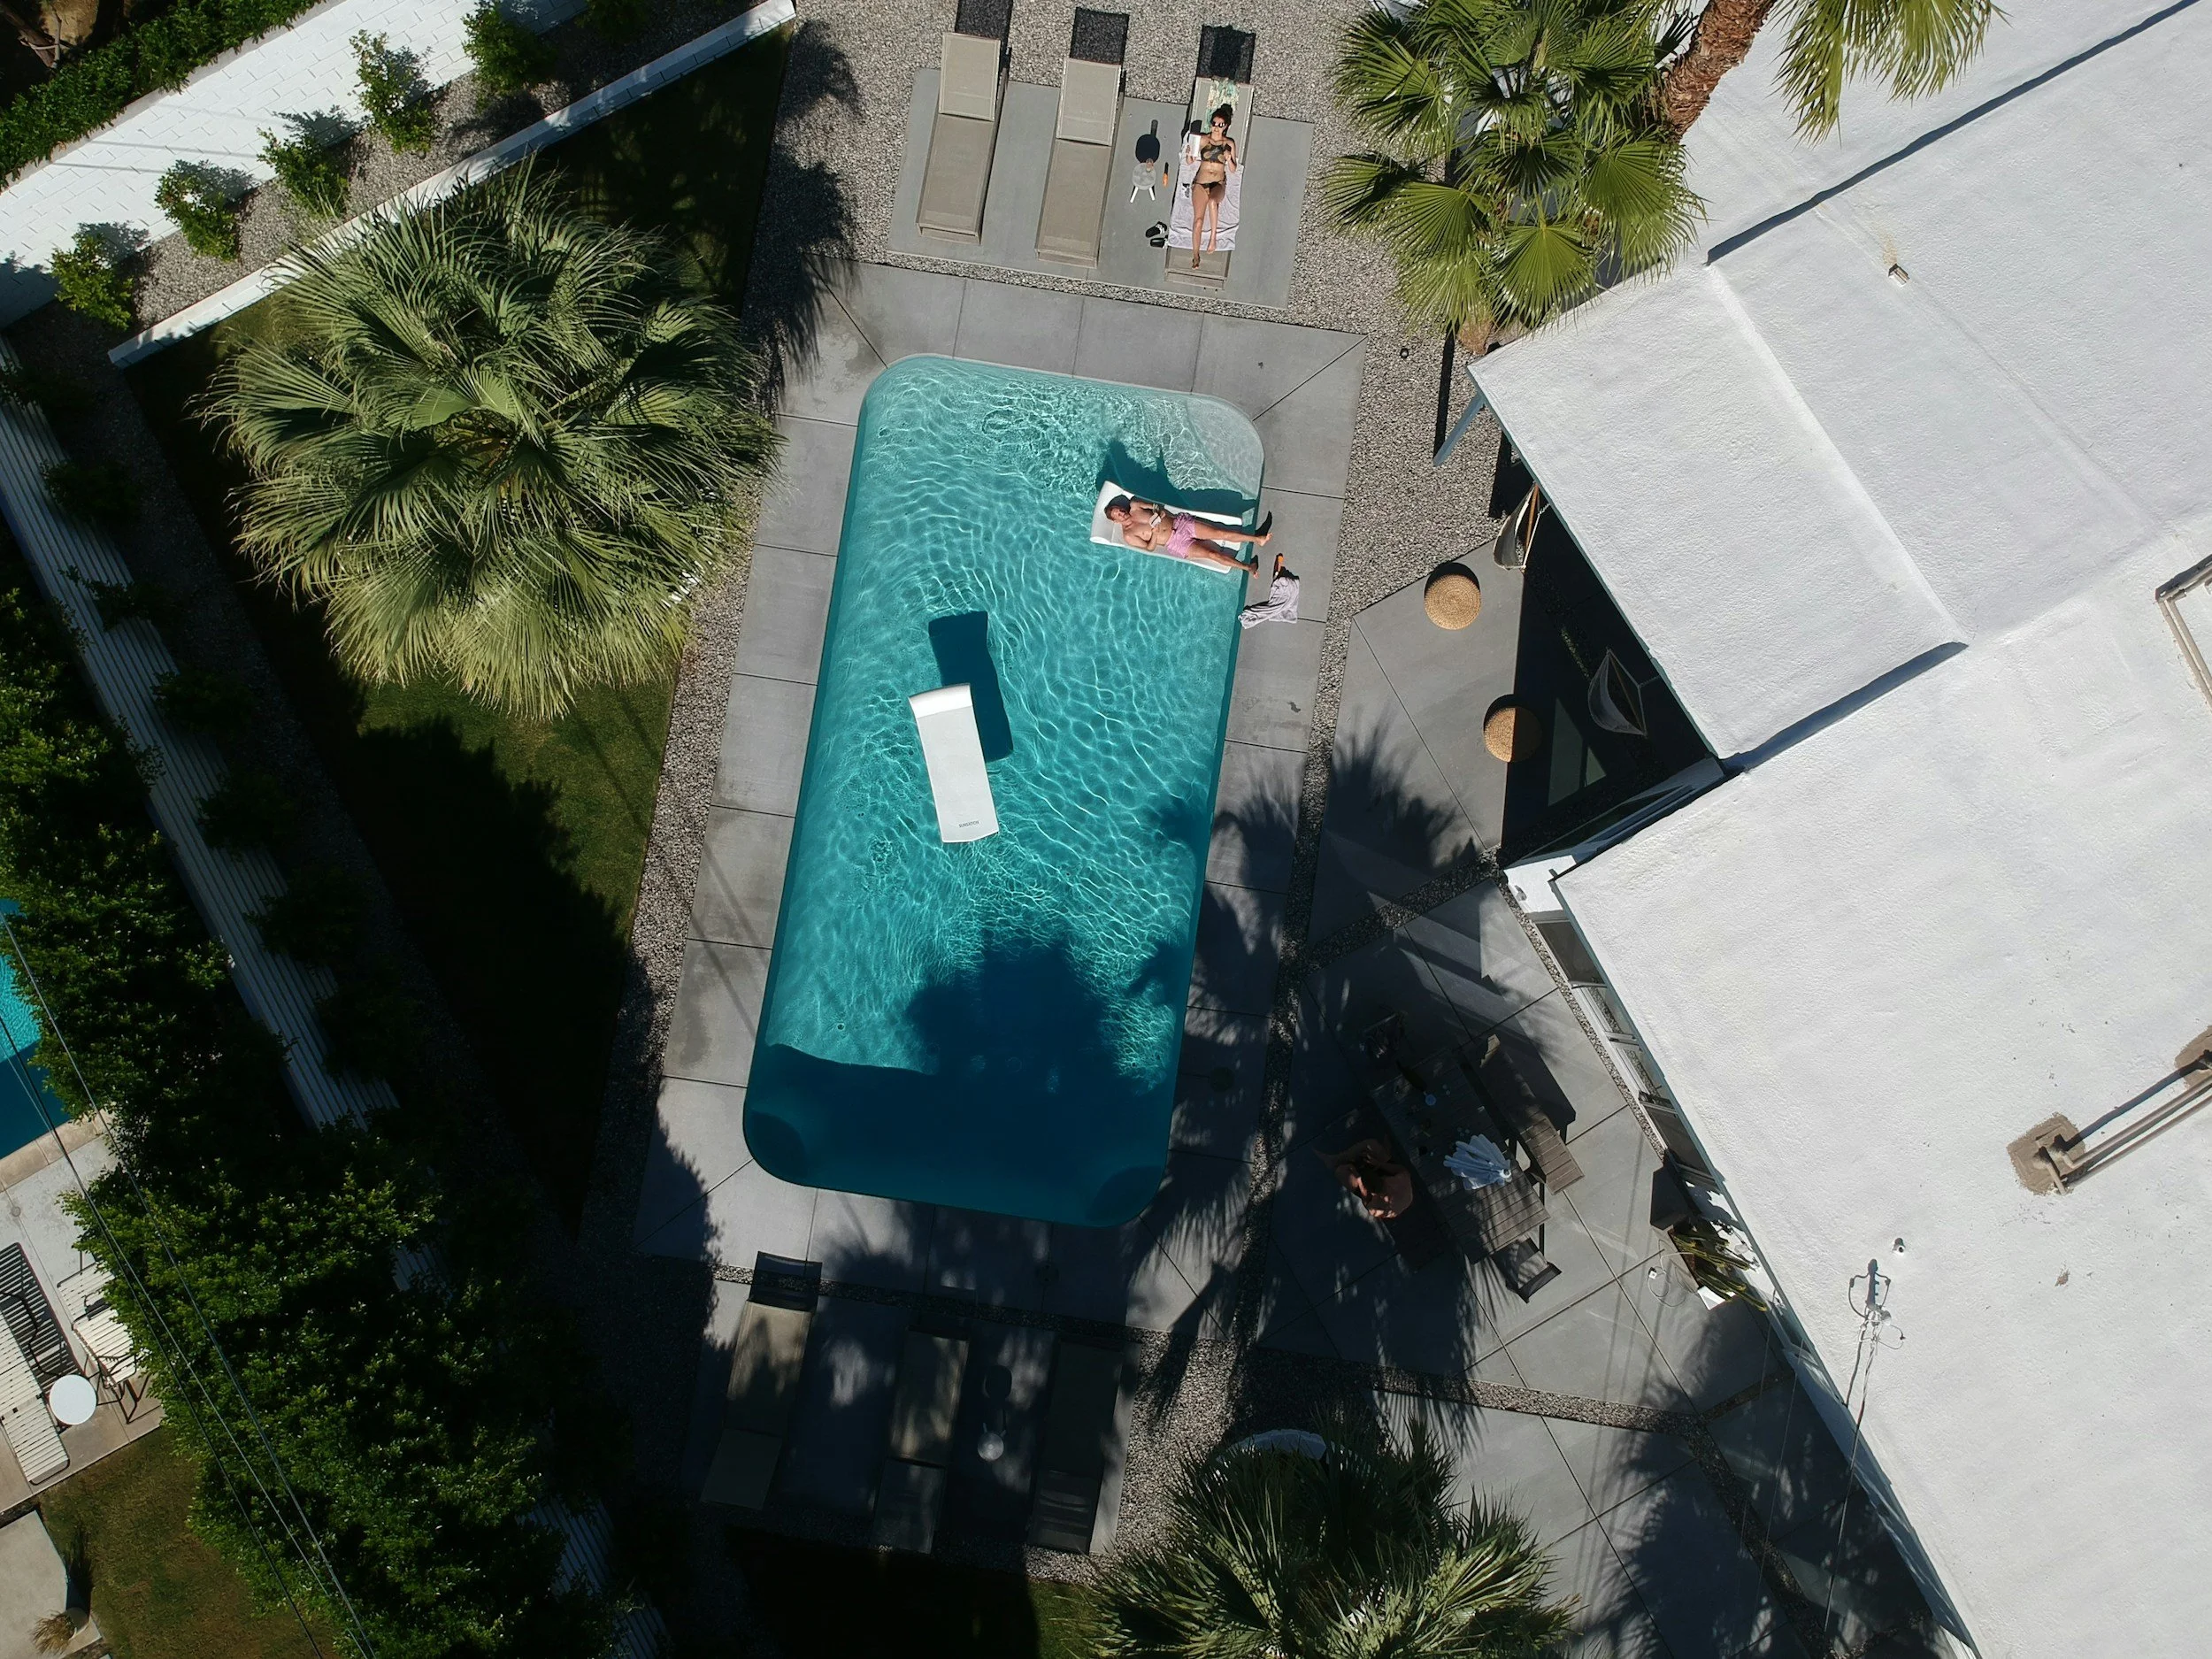
3) Amenities + experience design influence revenue (not just vibes)
Fresh analysis highlights how select amenities lift revenue metrics. For instance, AirDNA’s recent amenity review notes properties with certain amenities (like pools) can achieve higher RevPAR, even when ADR is similar, because occupancy rises—in one example translating to roughly $25 more in RevPAR per night. That’s design-plus-amenity synergy working in your favor. (AirDNA)
4) Photos and visual quality change conversion (and revenue)
Your images are your first showing. Airbnb’s own materials emphasize that high-quality photography is one of the biggest factors that determine which listing gets booked. And external studies reinforce that the type and quality of imagery materially affects click-through and booking intent (e.g., wide/panoramic “sense of place” shots can outperform tight close-ups). On the flip side, guest-generated low-quality photos in reviews correlate with a ~10% performance hit—a reminder that poor visuals can cost real money. (Airbnb)
Separately, industry data frequently cited by OTAs shows more complete photo sets and professional images raise inquiries and bookings (e.g., FlipKey-referenced analysis on more photos leading to more inquiries). While methodologies vary across platforms and years, the overall signal is consistent: better, richer visuals convert more travelers. (Futurestay)
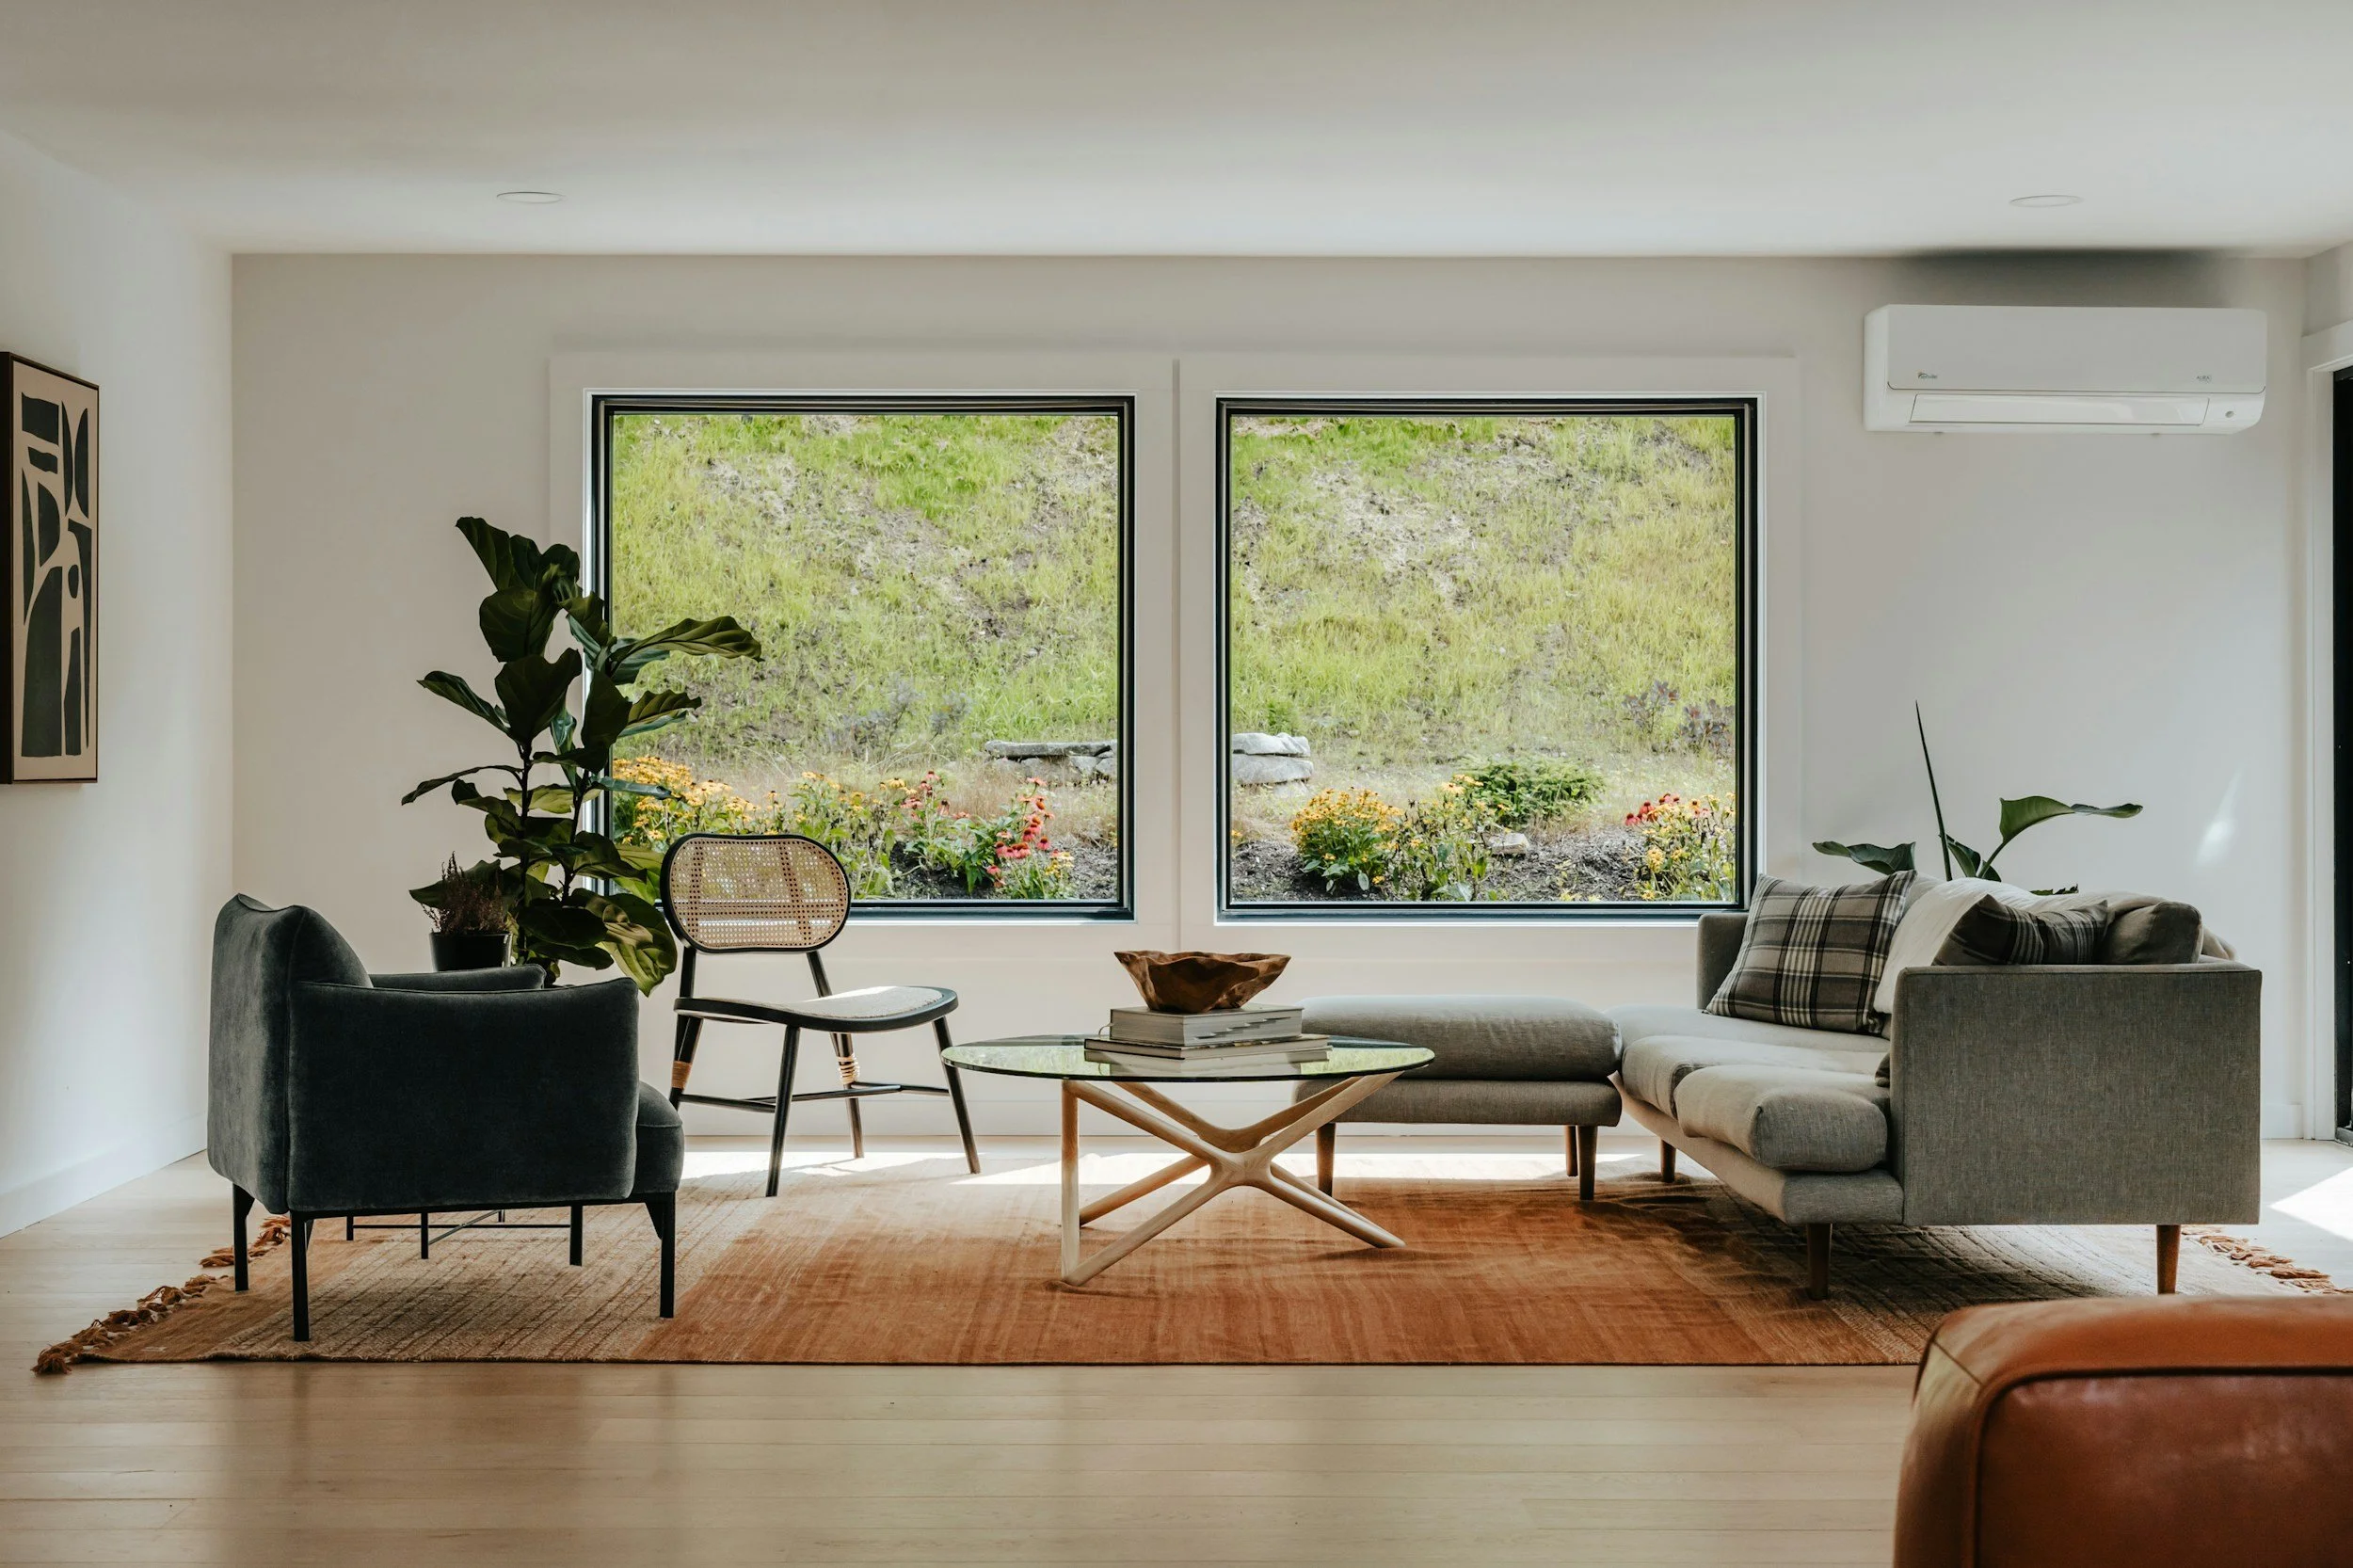
Why design changes the math (behaviorally speaking)
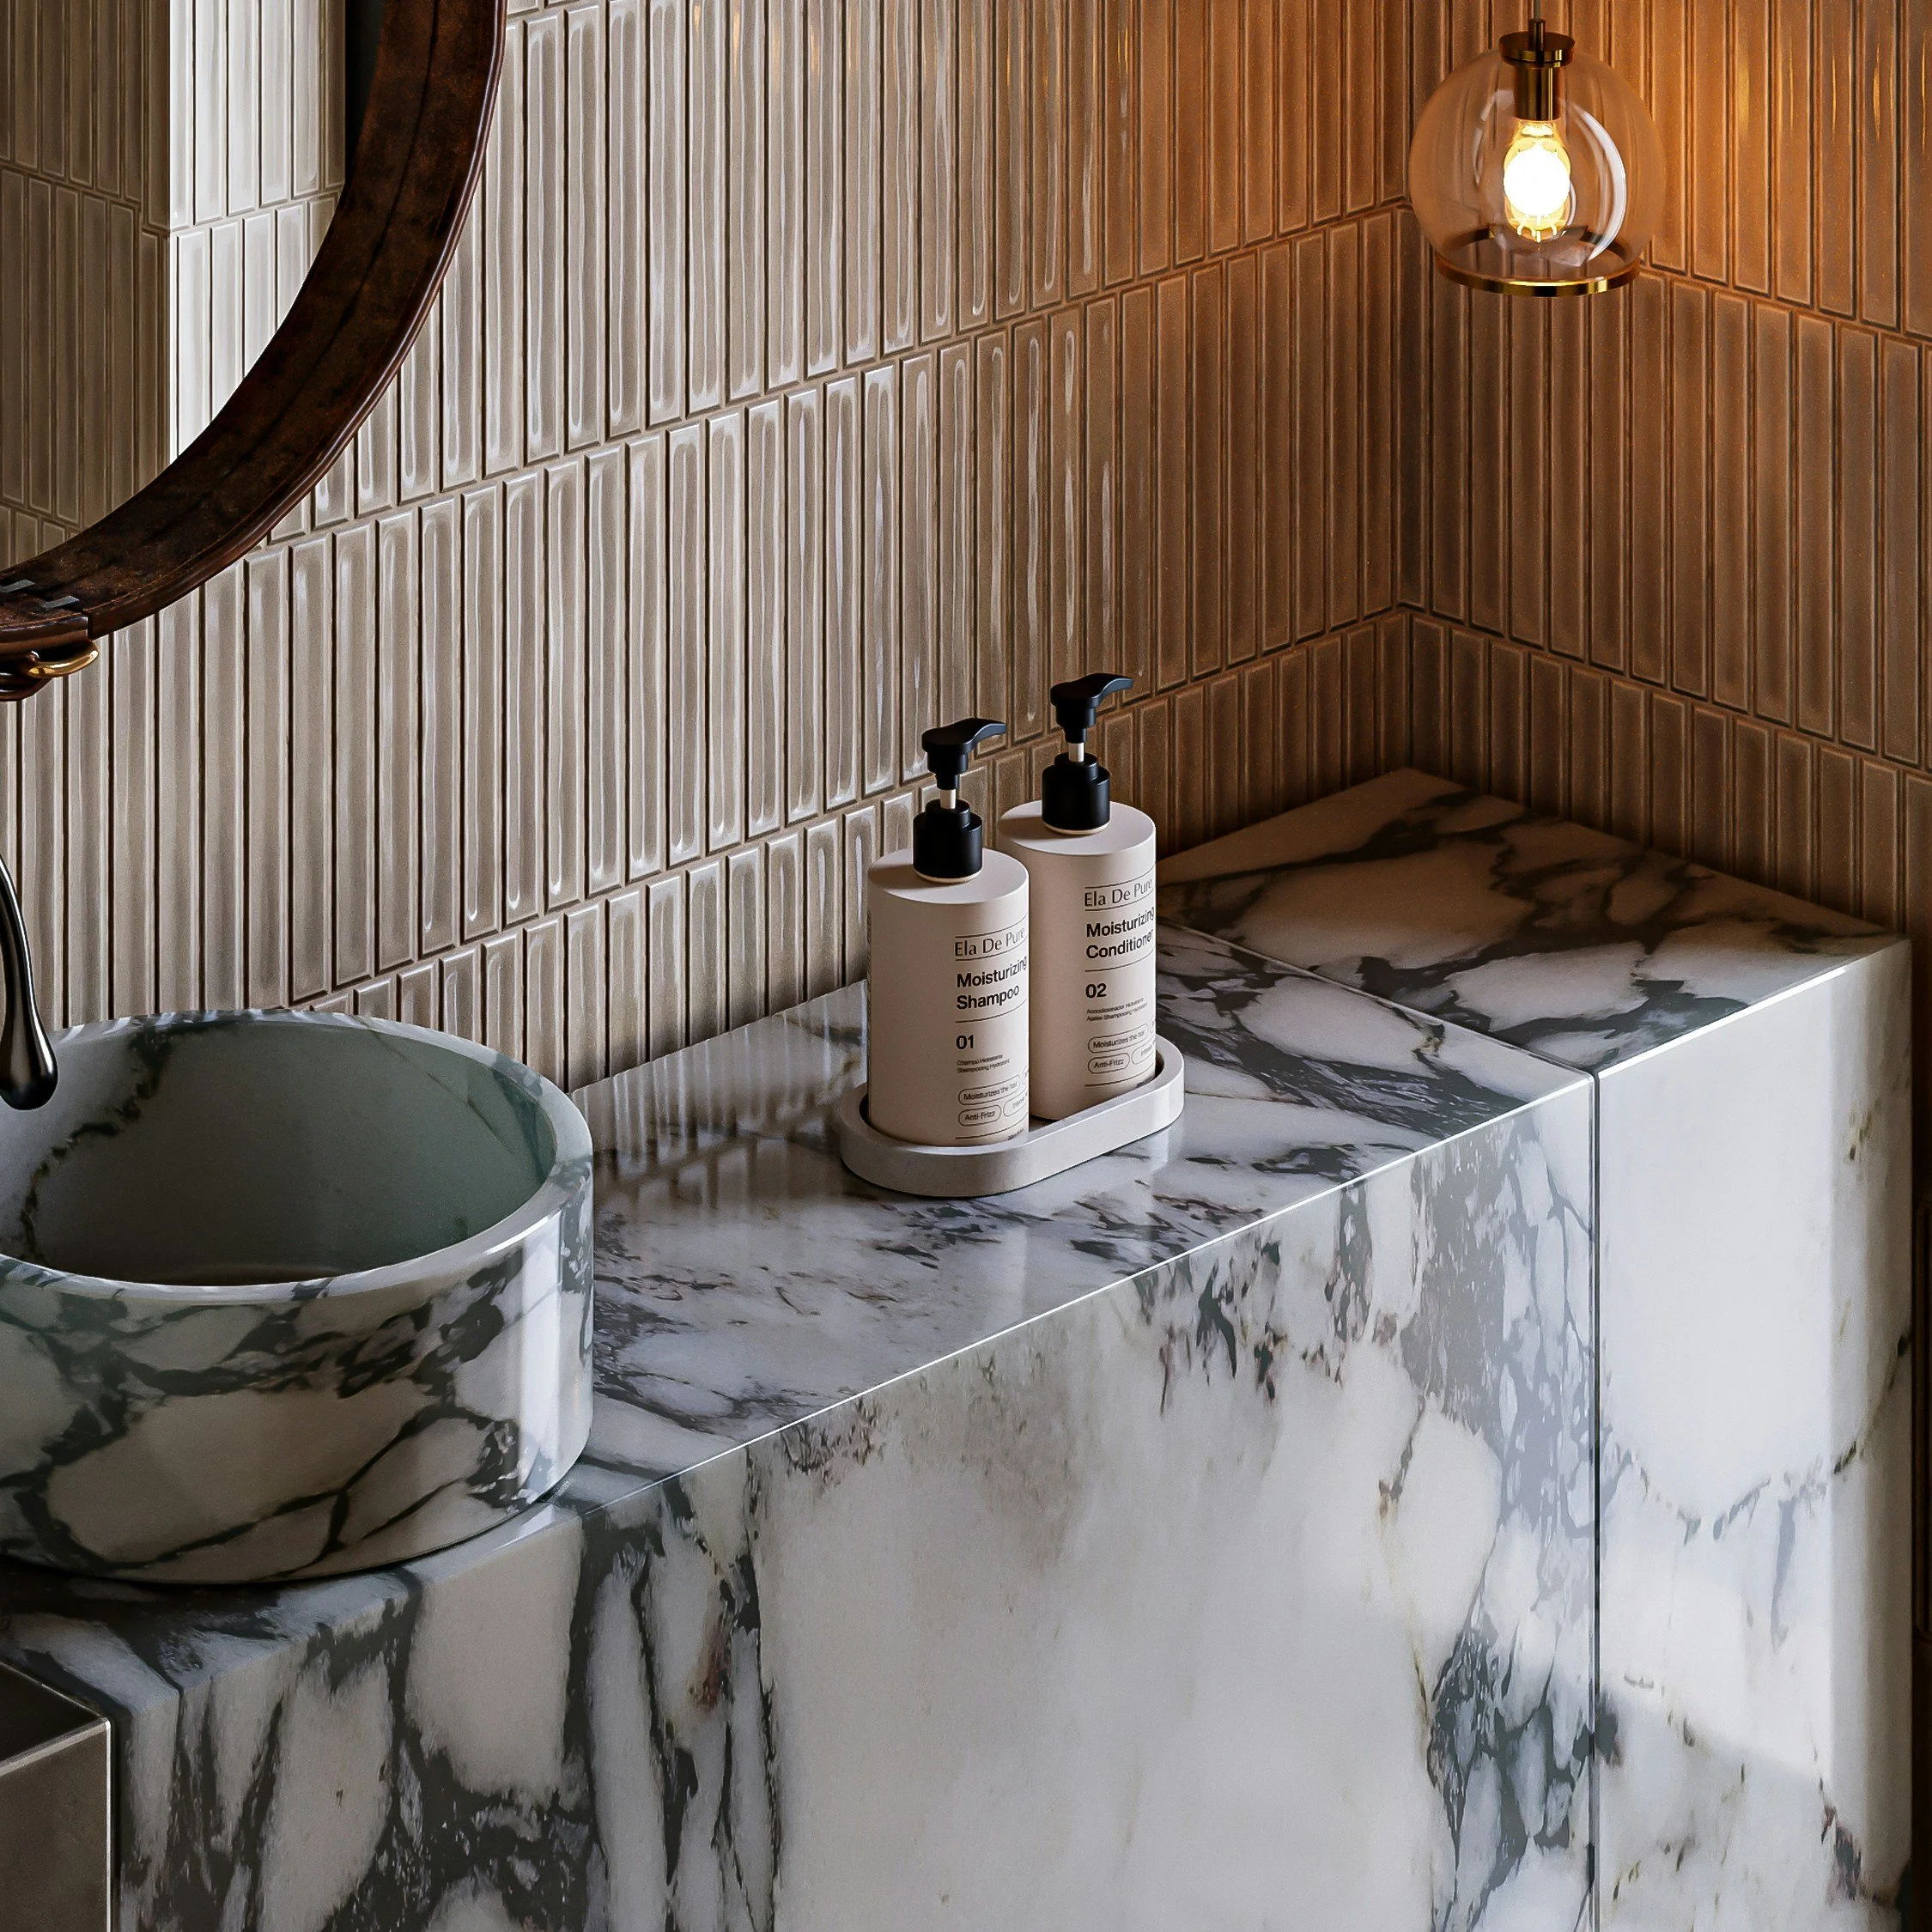
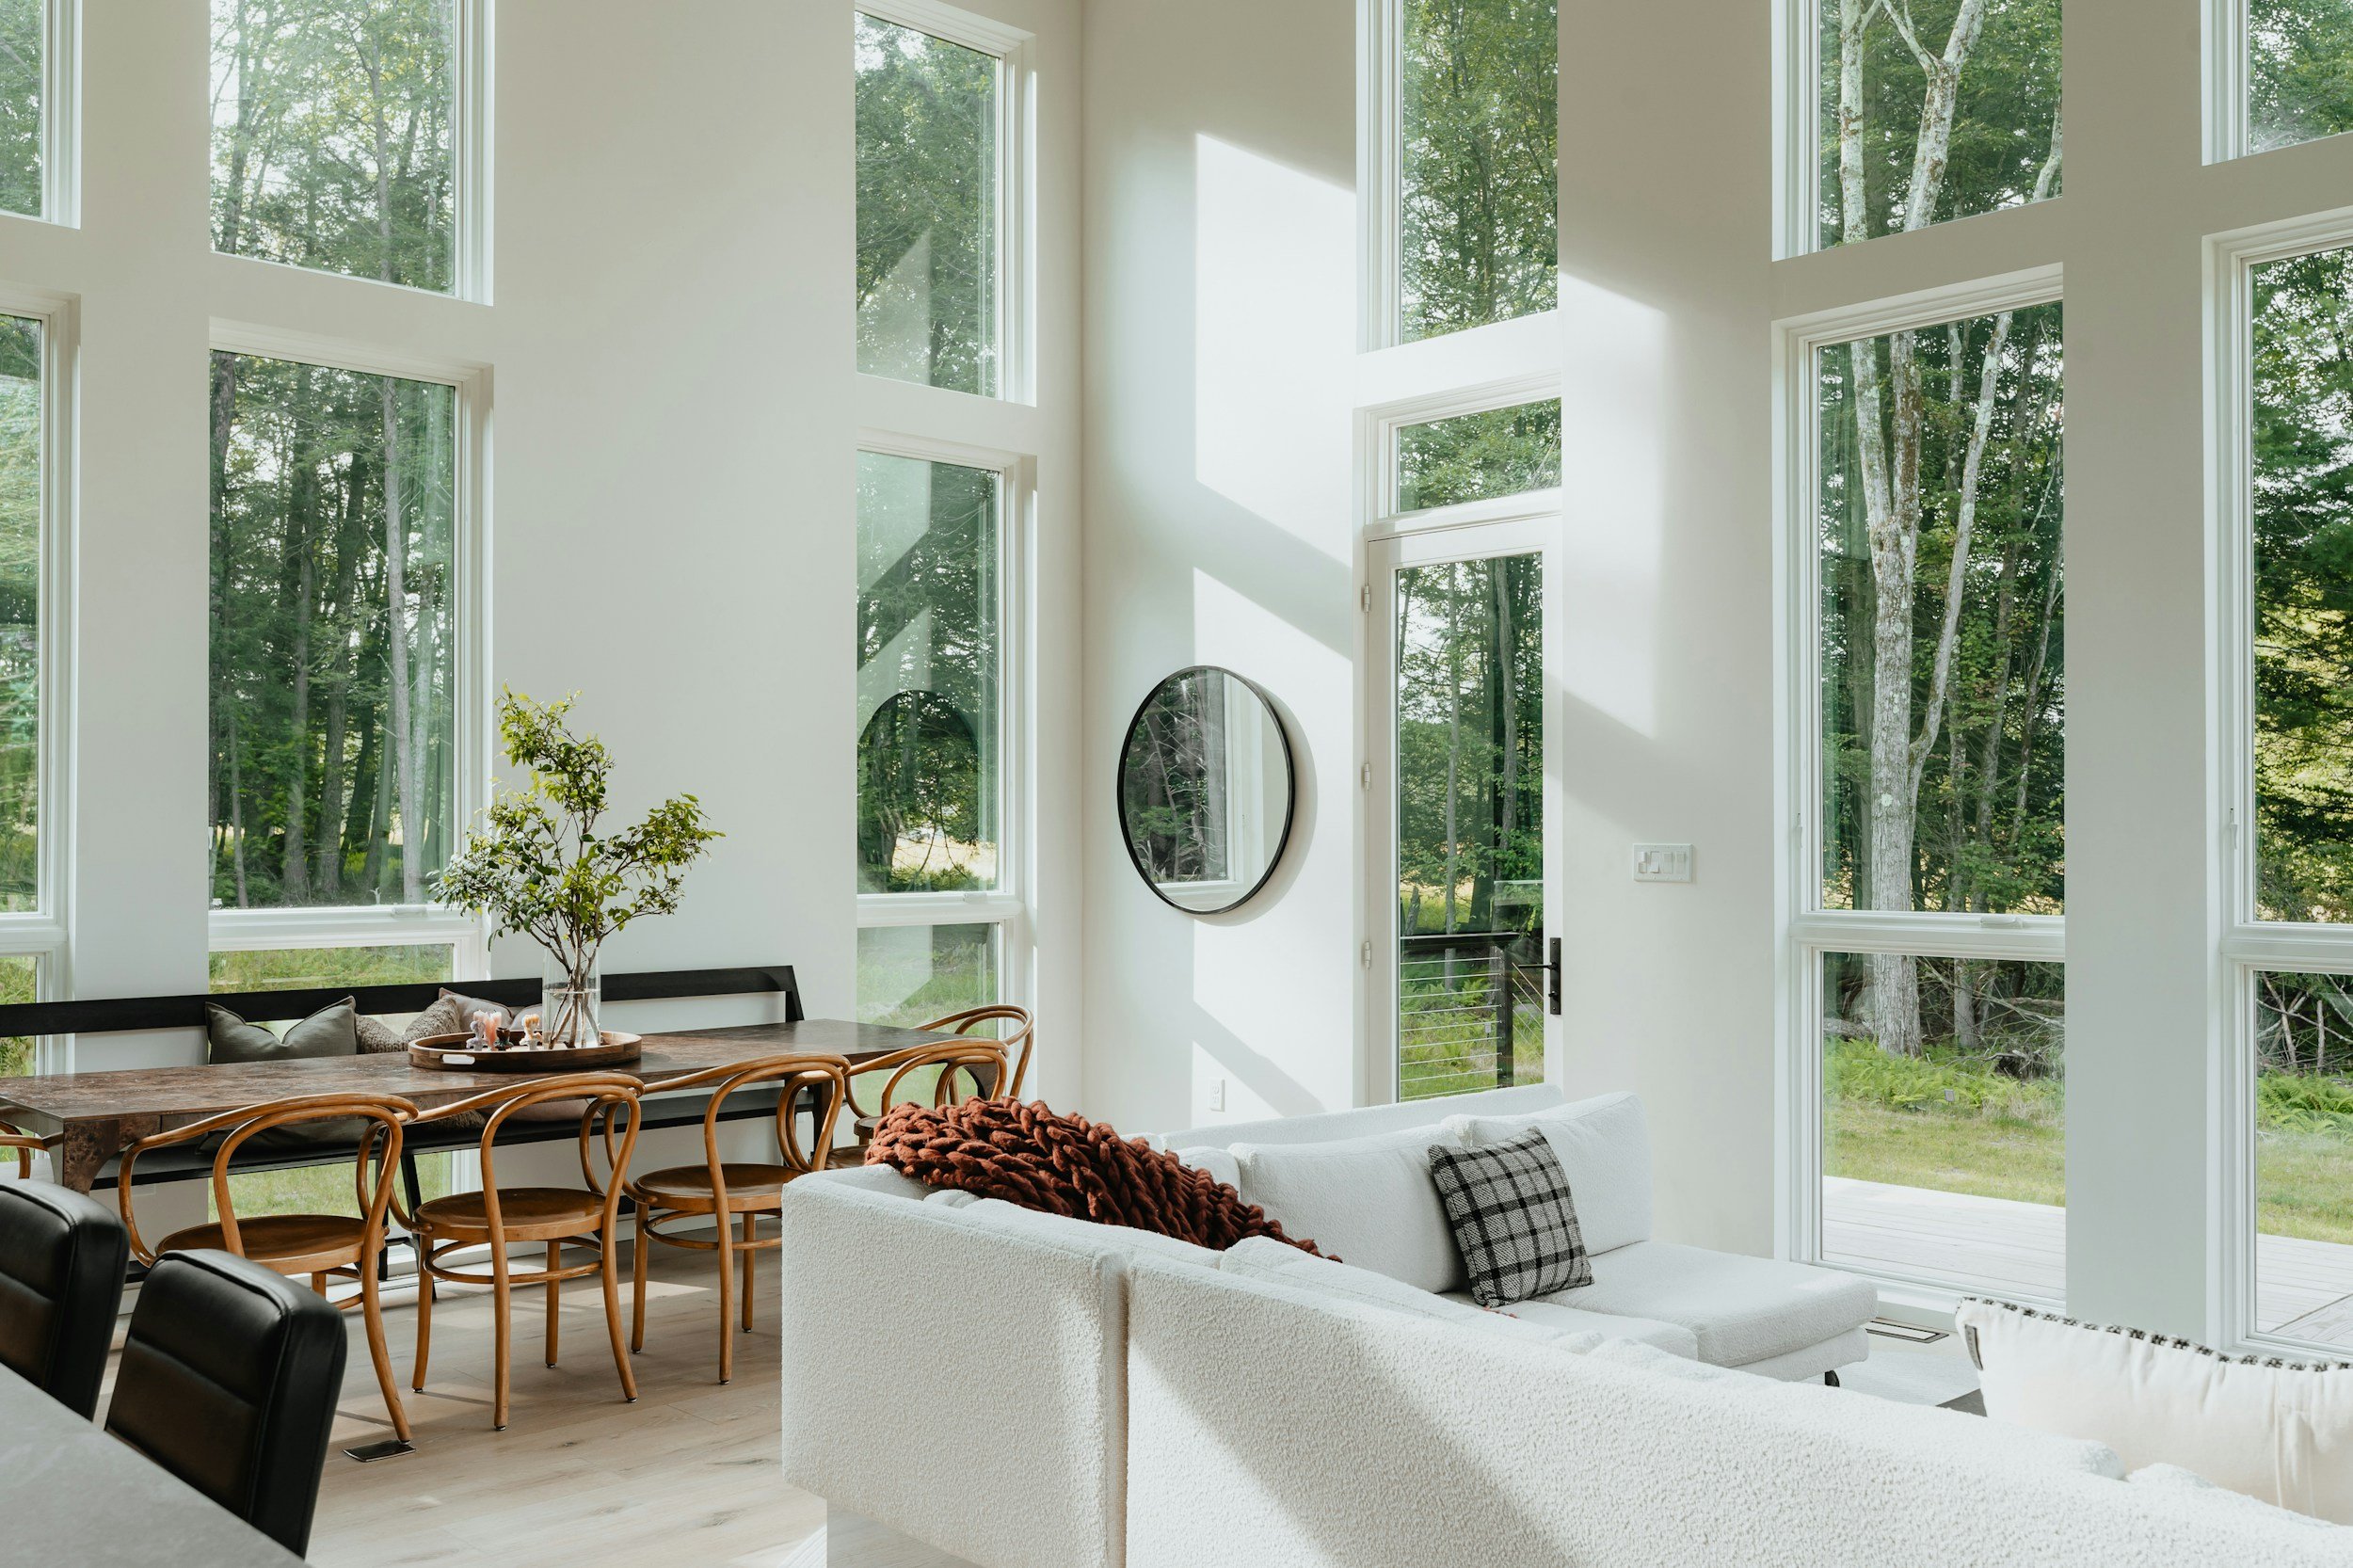
Perceived value → price tolerance (ADR): Cohesive style, quality materials, and intuitive layouts increase perceived value, letting you price with confidence. Peer-reviewed work on “servicescapes” and aesthetics shows guests will pay premiums when the environment signals quality, safety, and thoughtful design. (MDPI)
Effortless function → better reviews → more bookings: Design that anticipates needs (lighting layers, luggage drop spots, bedding comfort, kitchen usability, task surfaces) reduces guest friction. Fewer small annoyances = better reviews. Better reviews = measurable pricing/occupancy lift (see Cornell). (Cornell Nolan)
Distinctiveness → higher click-through: In crowded search results, listings with strong identity and clear hero shots stand out, earning more clicks and page time—prereqs to conversion. Controlled experiments have shown cover photo framing and scale influence booking intention. (SAGE Journals)
The ROI math (worked example)
Let’s put numbers to it. Imagine your 3-bed STR currently runs:
ADR: $225
Occupancy: 62% (0.62)
Nights available: 365
Current RevPAR = $225 × 0.62 = $139.50
Annual room revenue ≈ $139.50 × 365 = $50,917
Now, say you refresh interiors (cohesive style, upgraded textiles, layered lighting), add two high-impact amenities (e.g., fire pit + workspace), and reshoot with pro photography.
Conservative, research-aligned uplift scenario:
ADR up 8% from perceived value and better reputation over time (a subset of the Cornell price-elasticity finding, not the full 11.2%). New ADR ≈ $243. (Cornell Nolan)
Occupancy up 3 percentage points from improved conversion and reviews: 65%. (This is well within the range seen when reputation improves and amenities help fill shoulder nights.) (AirDNA)
New RevPAR = $243 × 0.65 = $157.95
New annual room revenue ≈ $157.95 × 365 = $57,651
Annual lift ≈ $6,734 (before costs).
If your refresh budget is $12,000 (design plan, priority furnishings, decor, lighting, pro photos), your simple-payback is ~1.8 years. And that’s before you consider downstream compounding effects (more five-star reviews → sustained ADR resilience, higher shoulder season occupancy, tougher comps catching up slowly). If you time the reveal pre-peak season, your payback shortens.
Note: Plenty of projects outperform this—especially if your starting point is “builder basic” and your market skews visual/experience-driven (coastal, mountain, design-savvy urban).
Where to invest first (highest ROI design plays)
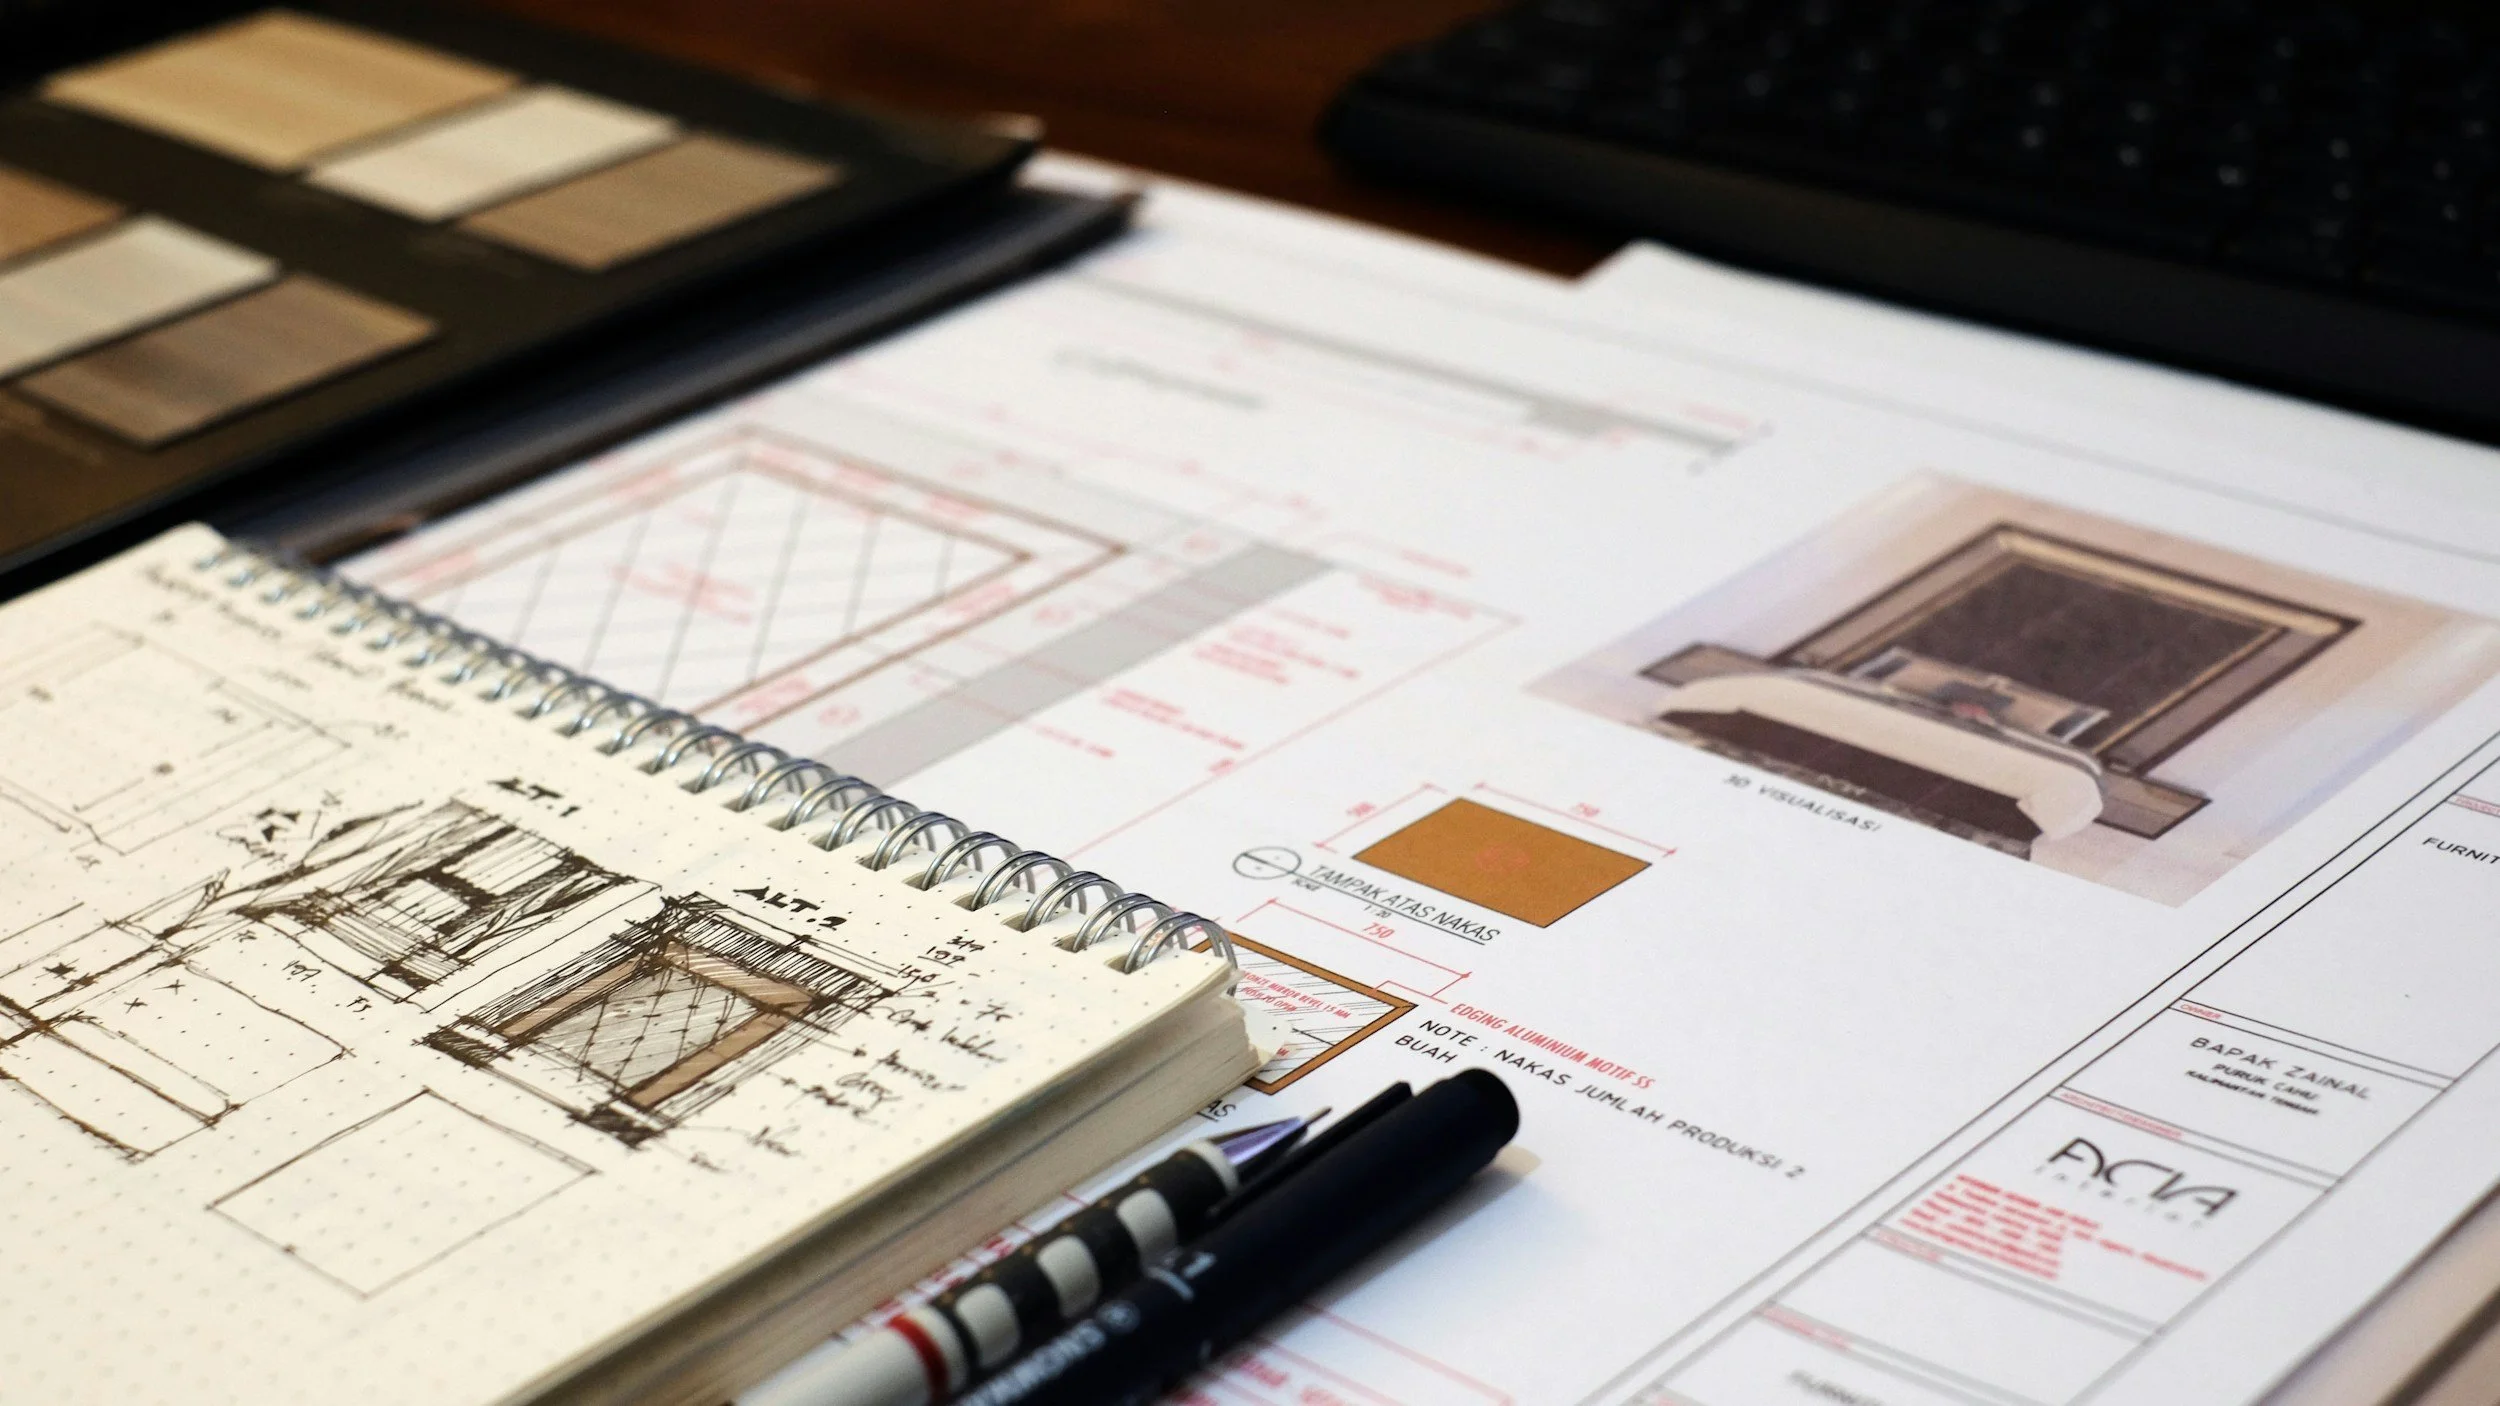
1) Photographic story + cover shot hierarchy
Shoot for the feed: One killer hero image that conveys space, light, and identity—then a logical sequence (living → kitchen → primary → secondary → baths → outdoor).
Show function: Workspace, coffee station, kid-friendly storage, pet items, board games. These are conversion boosters and review fodder.
Refresh annually: At minimum, re-shoot after upgrades or seasonal styling. Airbnb’s own materials emphasize high-quality images as a key ranking/engagement factor; treat them as a revenue asset. (Airbnb)
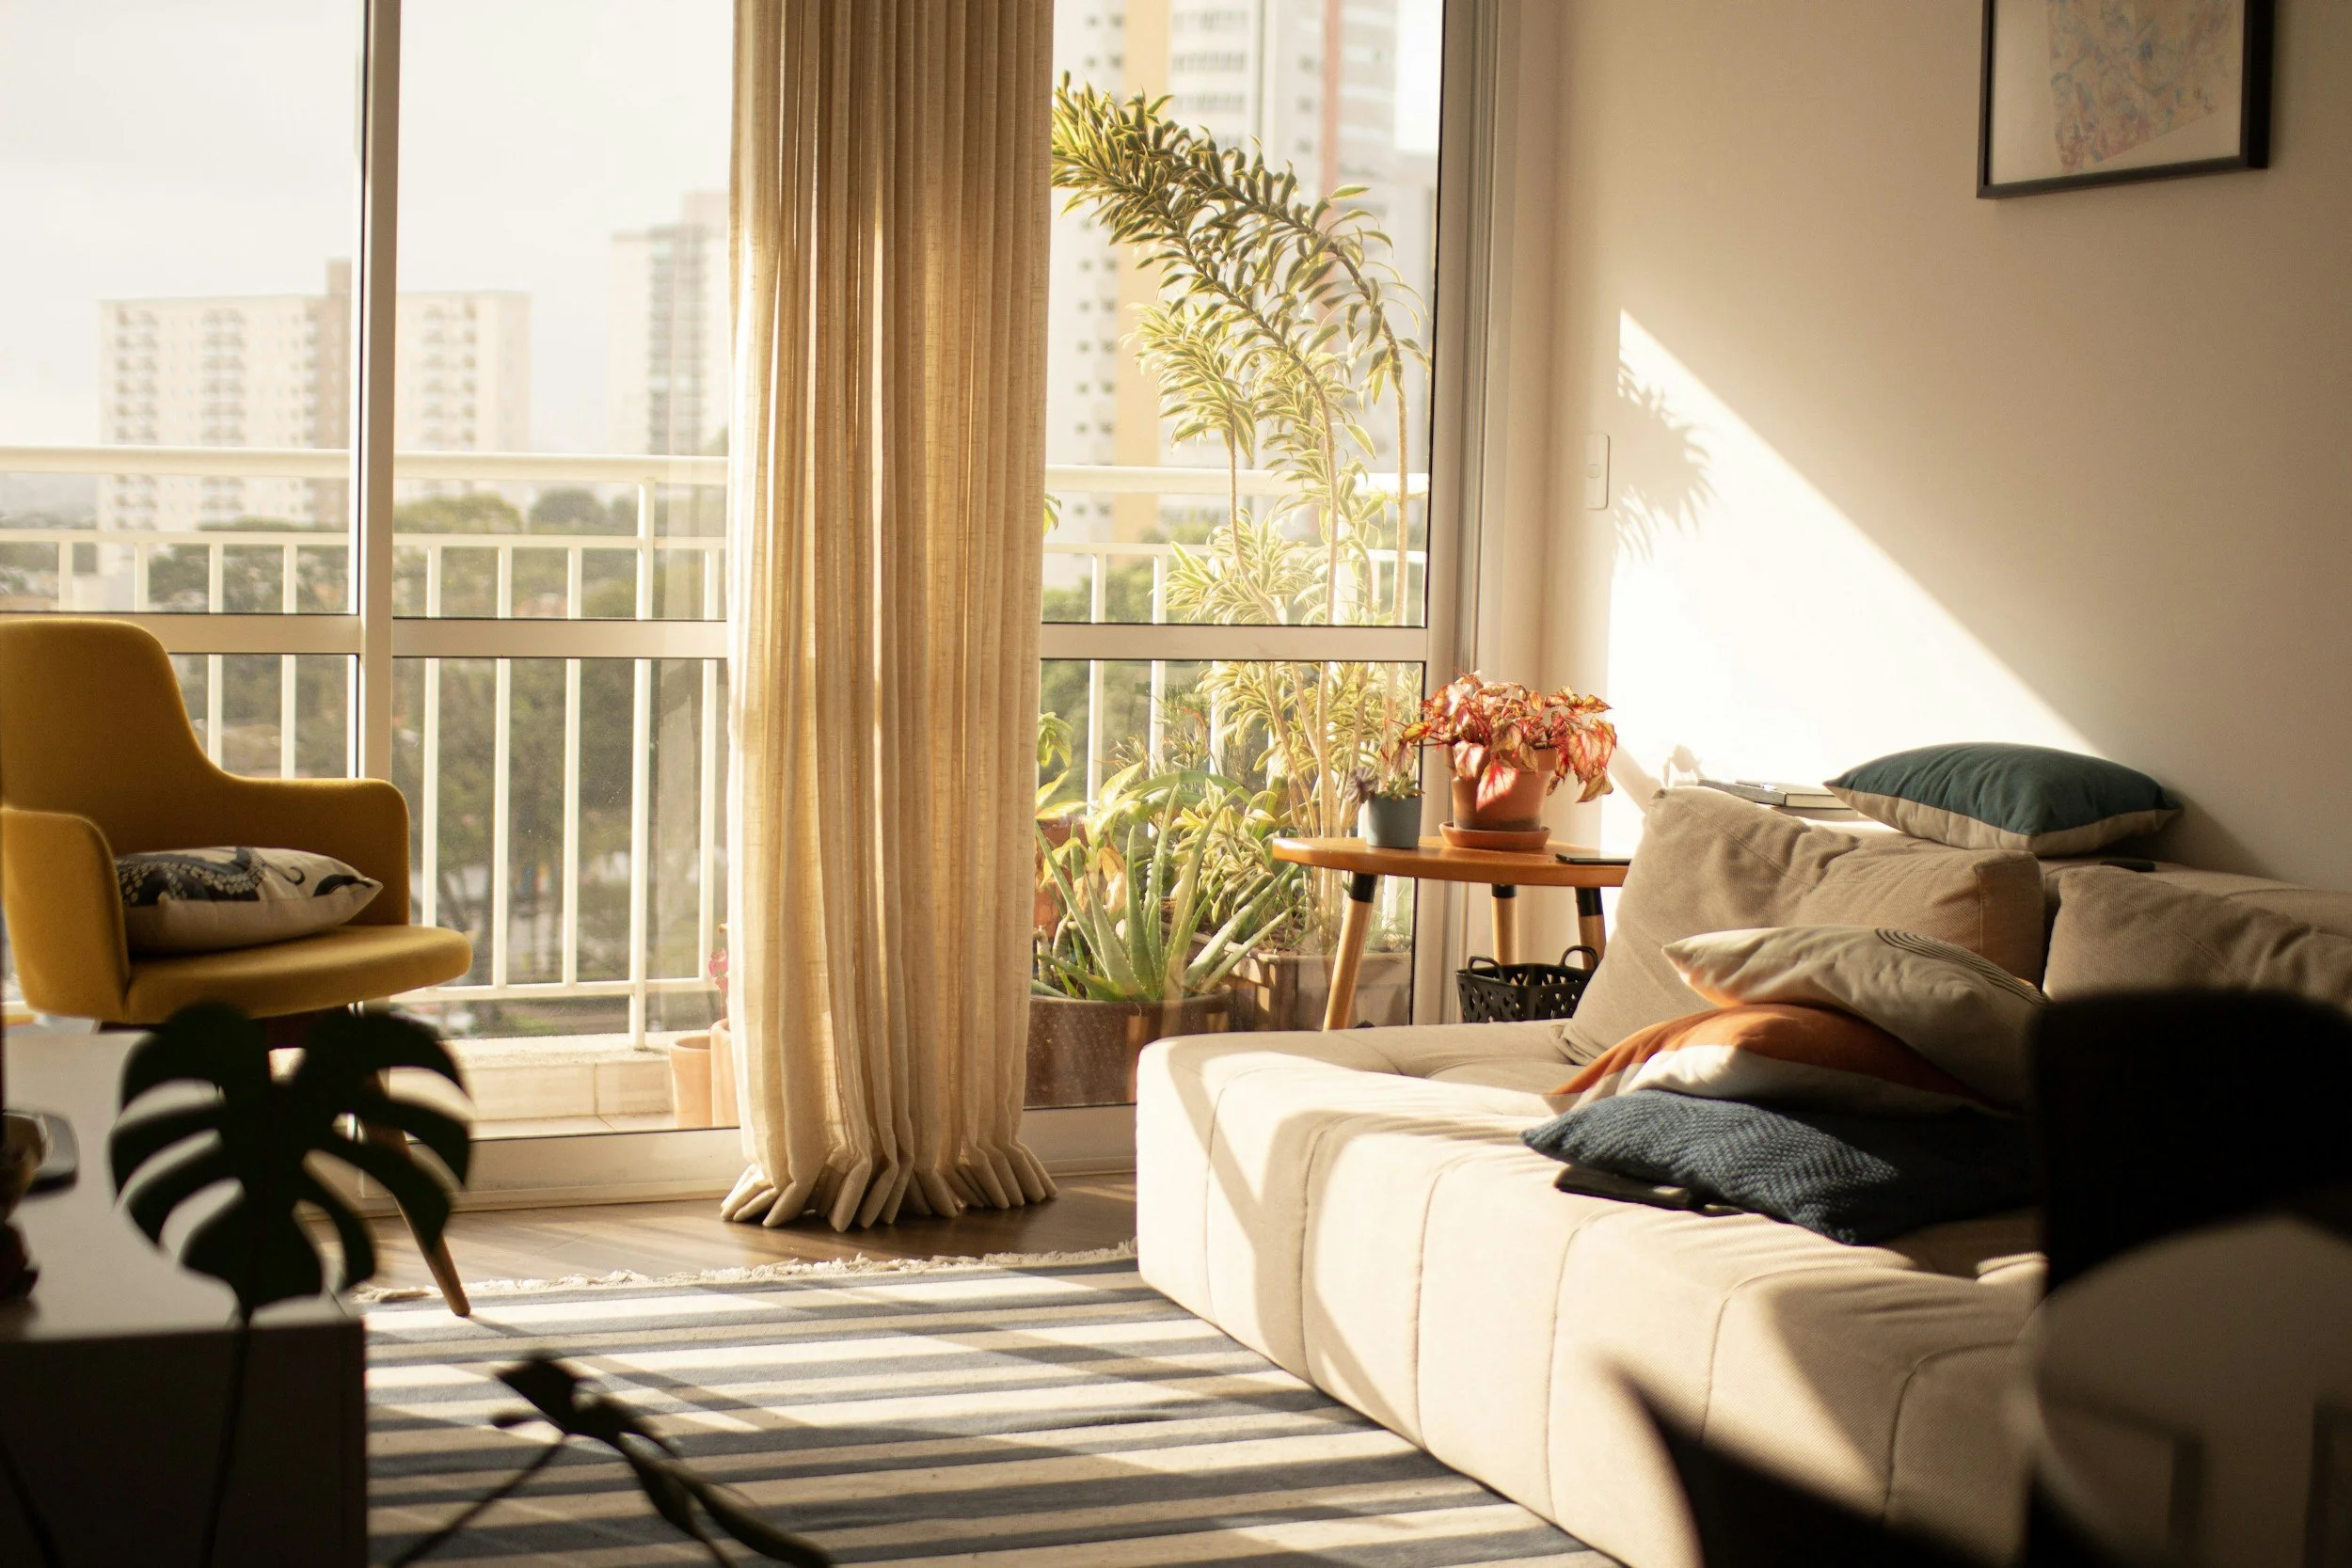
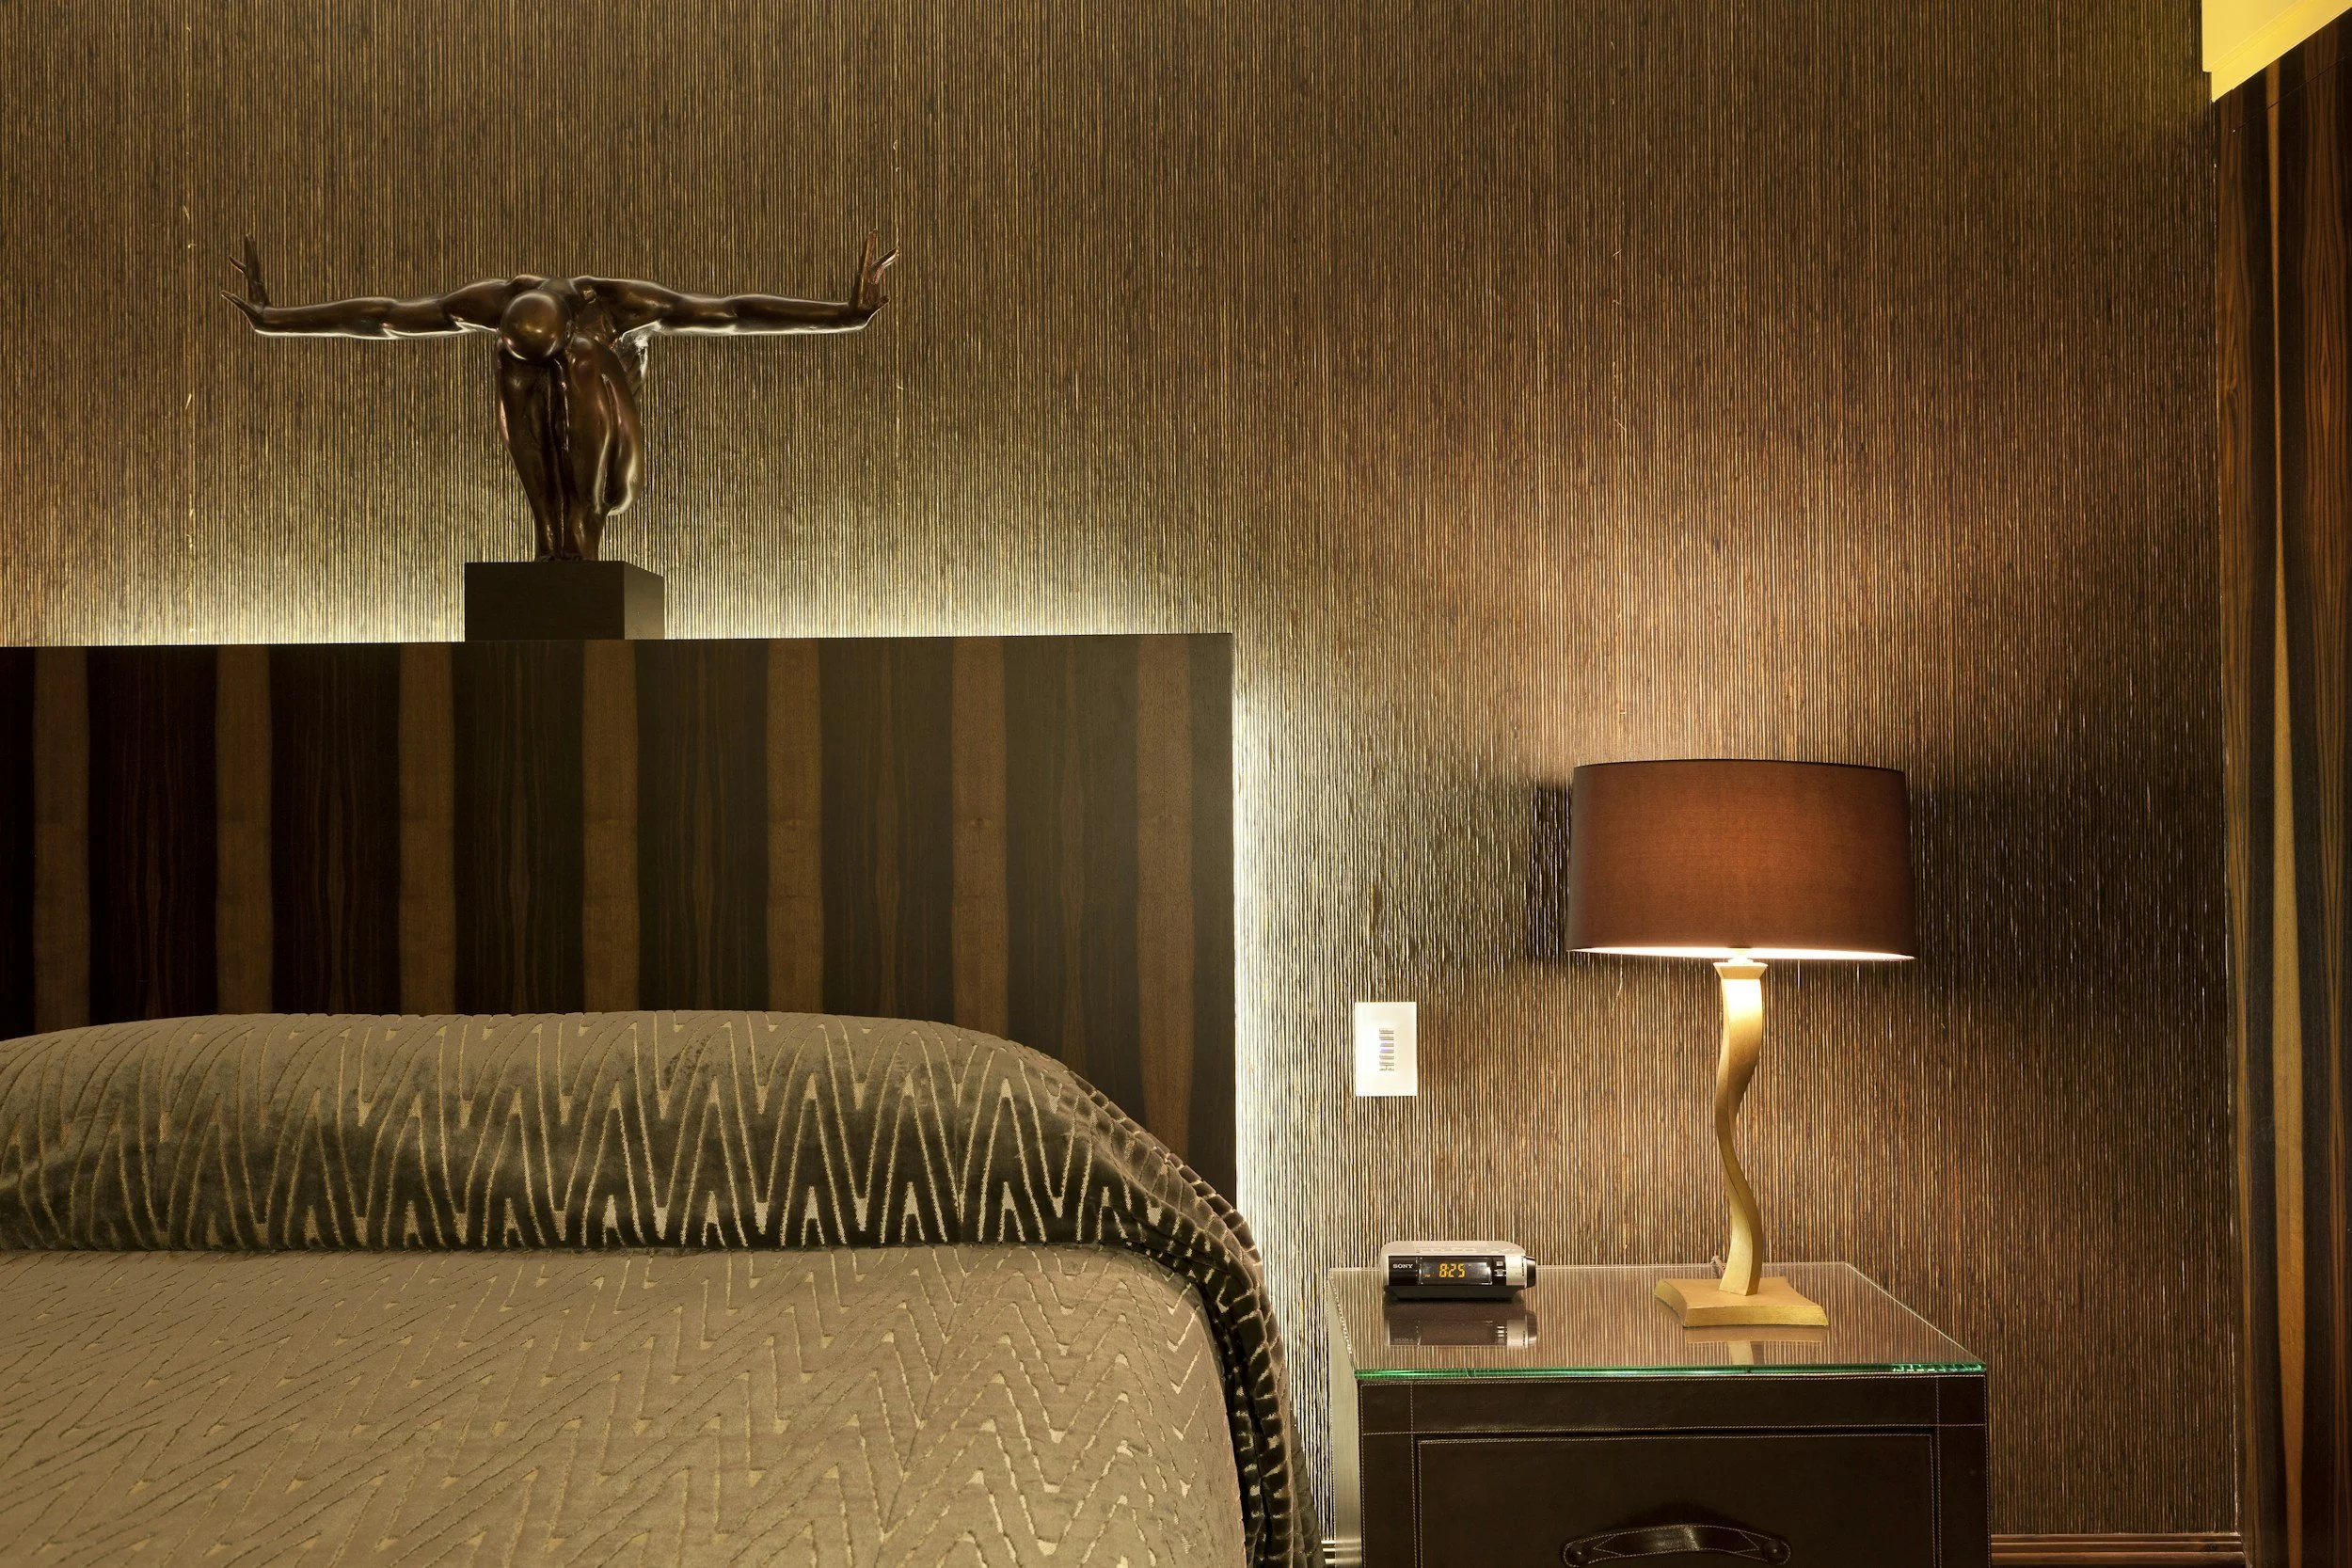
2) Lighting layers (the cheapest luxury)
Add overhead + task + ambient (dimmers wherever possible).
Prioritize warm color temps in living/sleeping, CRI 90+ bulbs for true color rendering.
Lighting shapes mood (and your photos) and reduces the most common guest complaints (“too dark,” “felt dingy”).
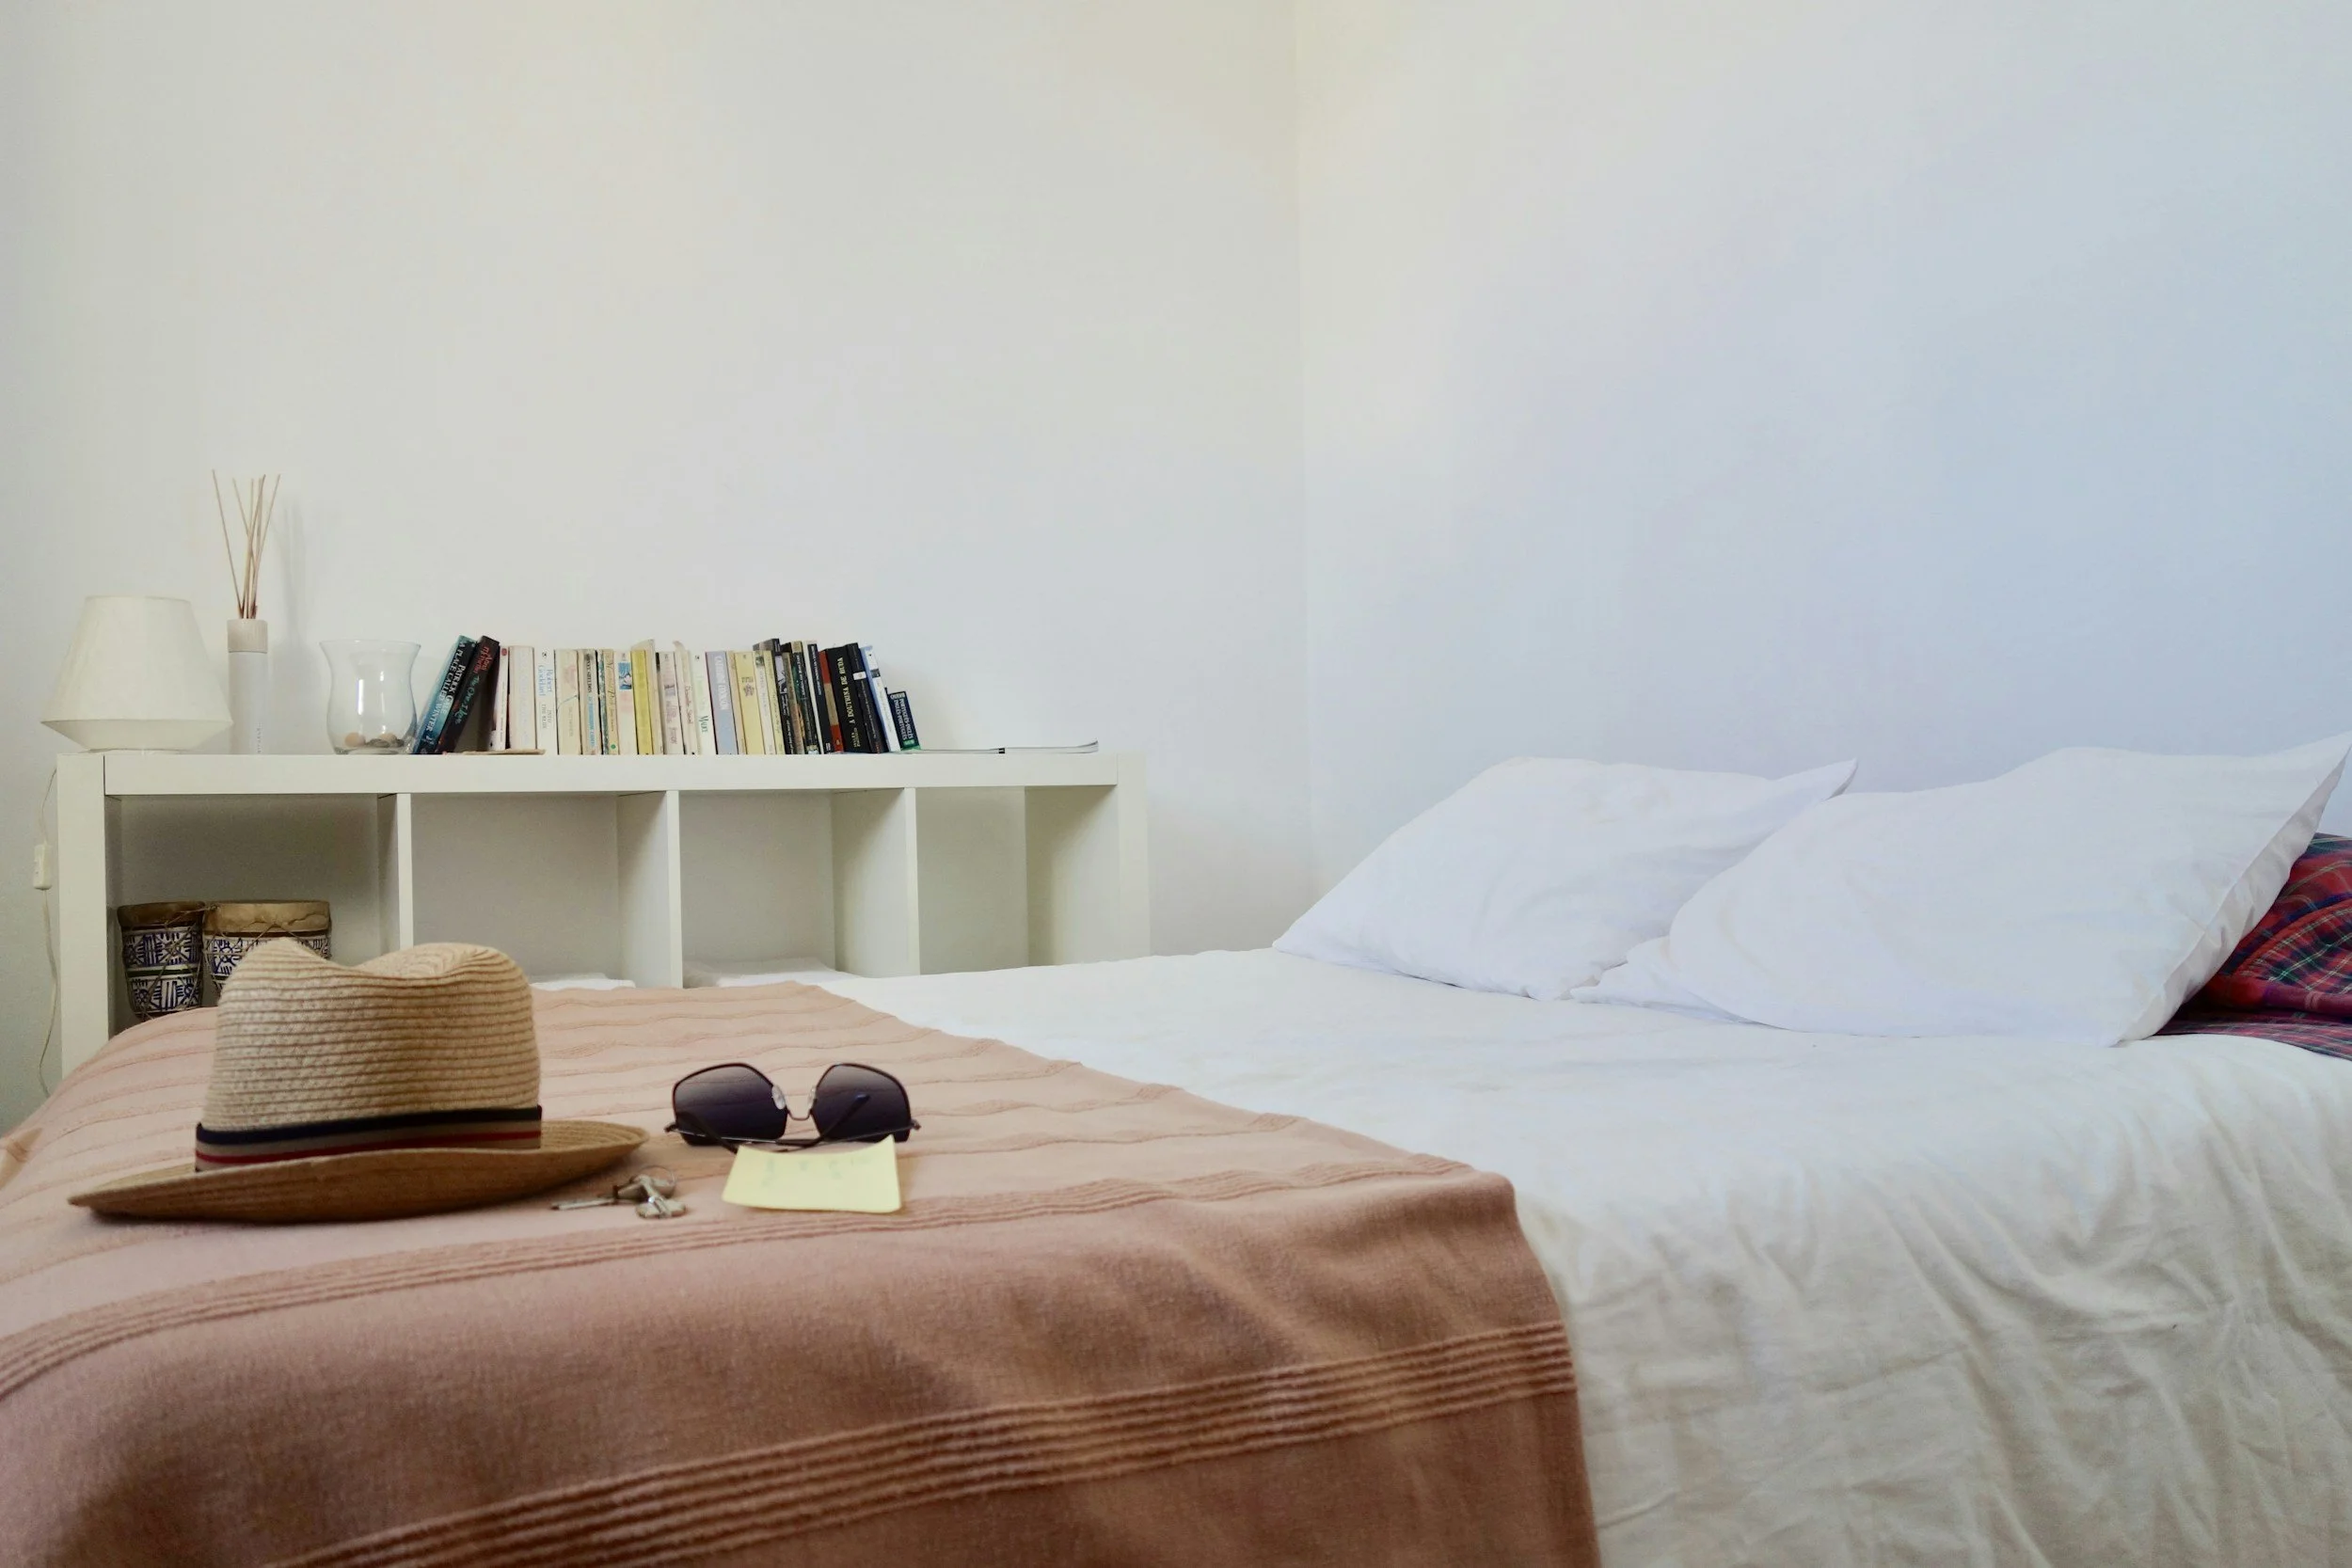
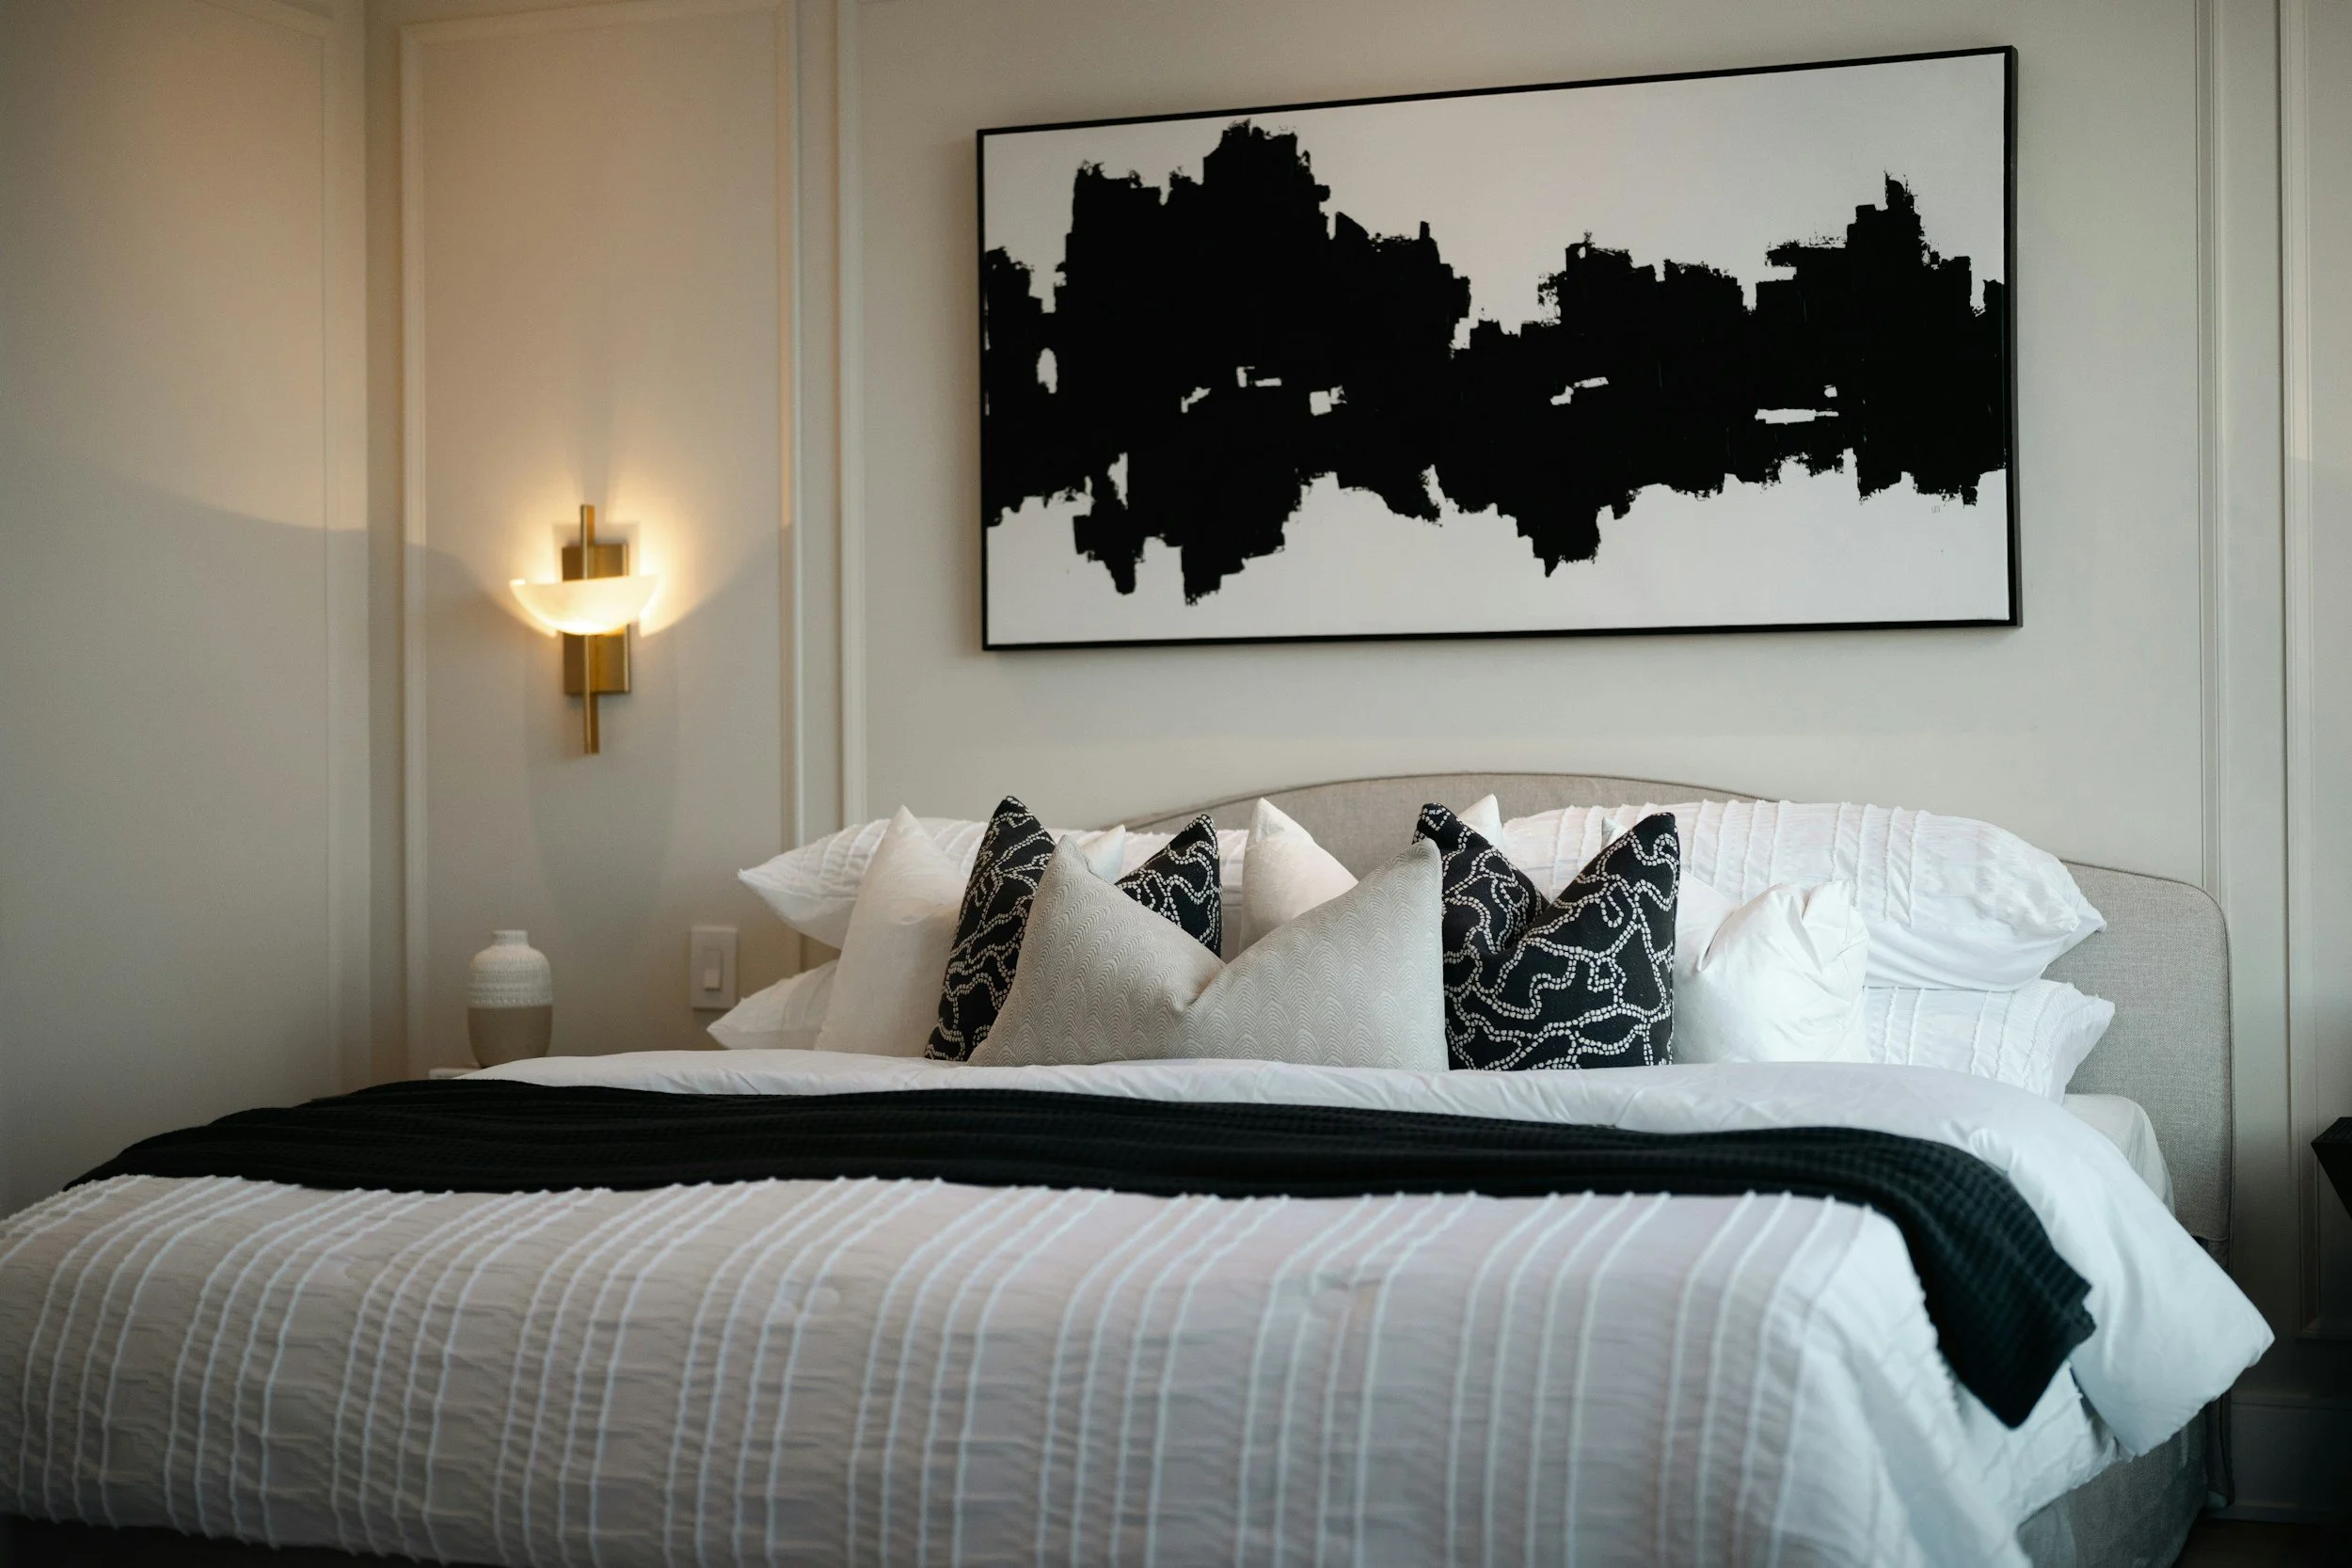
3) Comfort stack: beds, textiles, and sound
Mattresses + pillows are your nightly NPS. Upgrading here is often the fastest path to better reviews.
Layer texture (duvet + quilt + throw) and standardize extras for housekeeping efficiency.
Simple sound-softening (rugs, drapery, soft seating) makes small spaces feel peaceful.
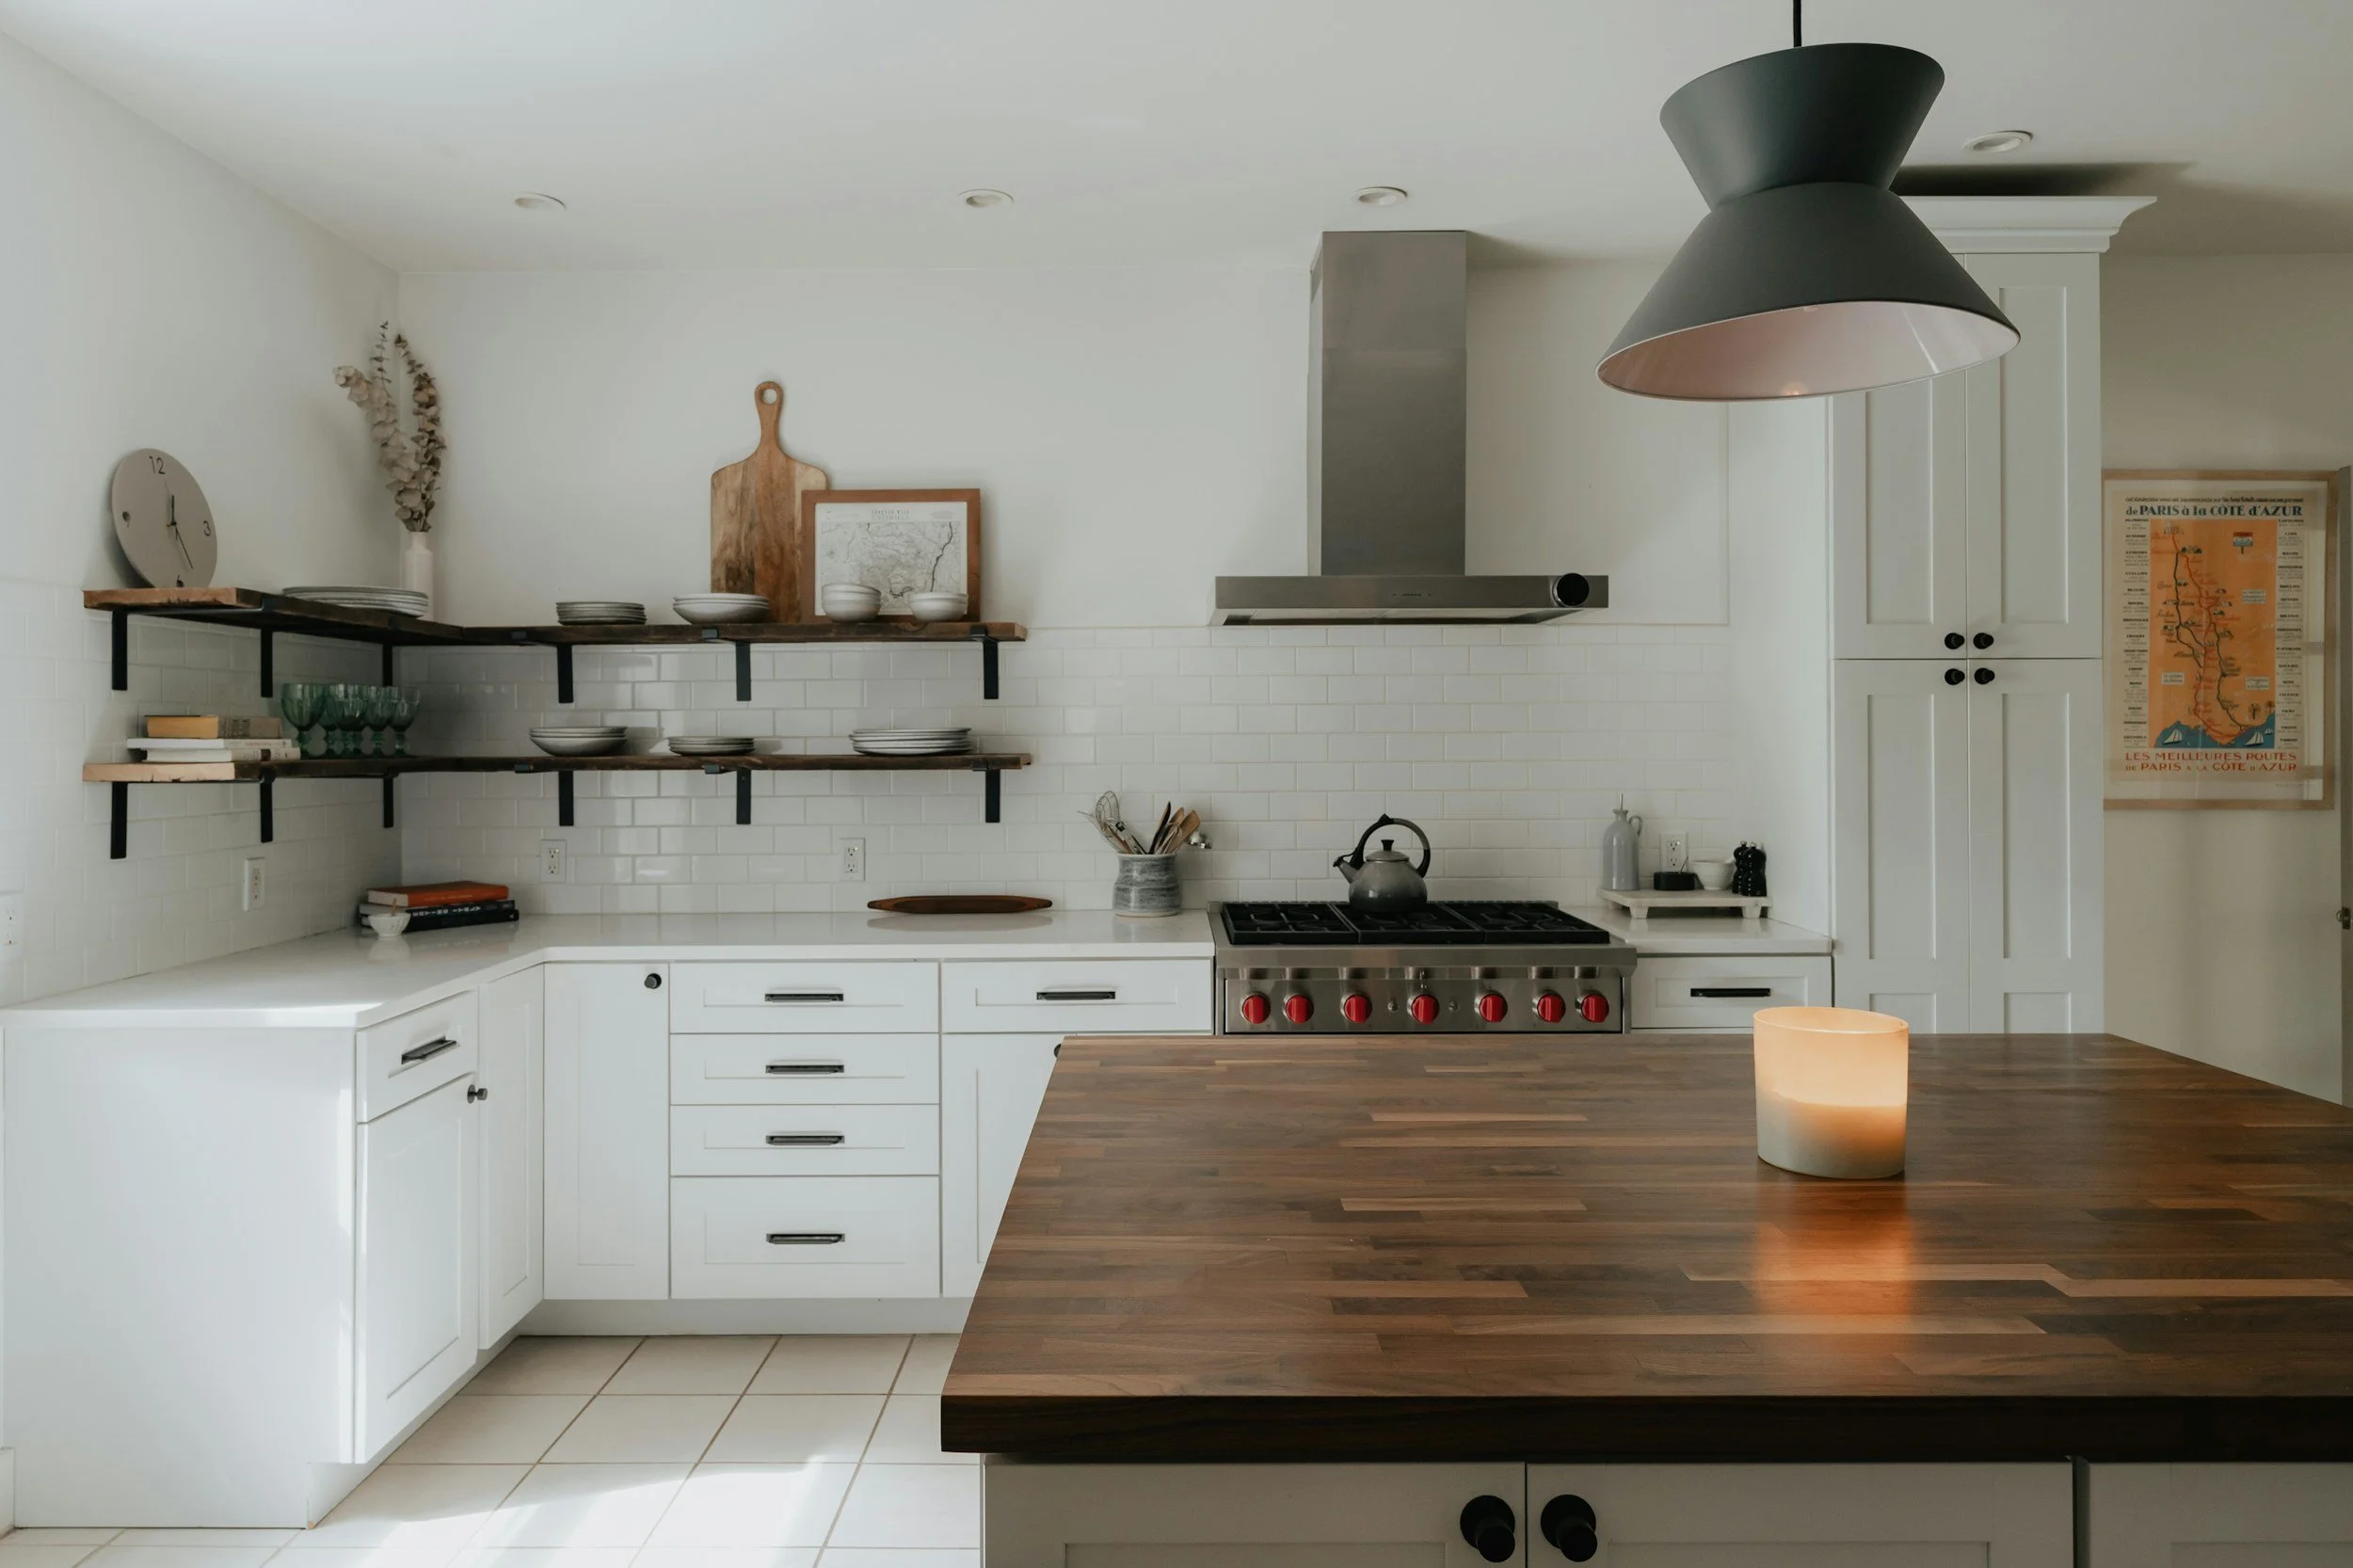
4) Kitchen clarity (more five-stars, longer stays)
Edit to essentials guests actually use; label or create a one-page kitchen guide.
Stock a consistent coffee/tea setup; it photographs well and anchors the morning ritual.
Organize for intuitive flow (trash/recycling visible, cookware near ranges, kid plates in a low drawer).
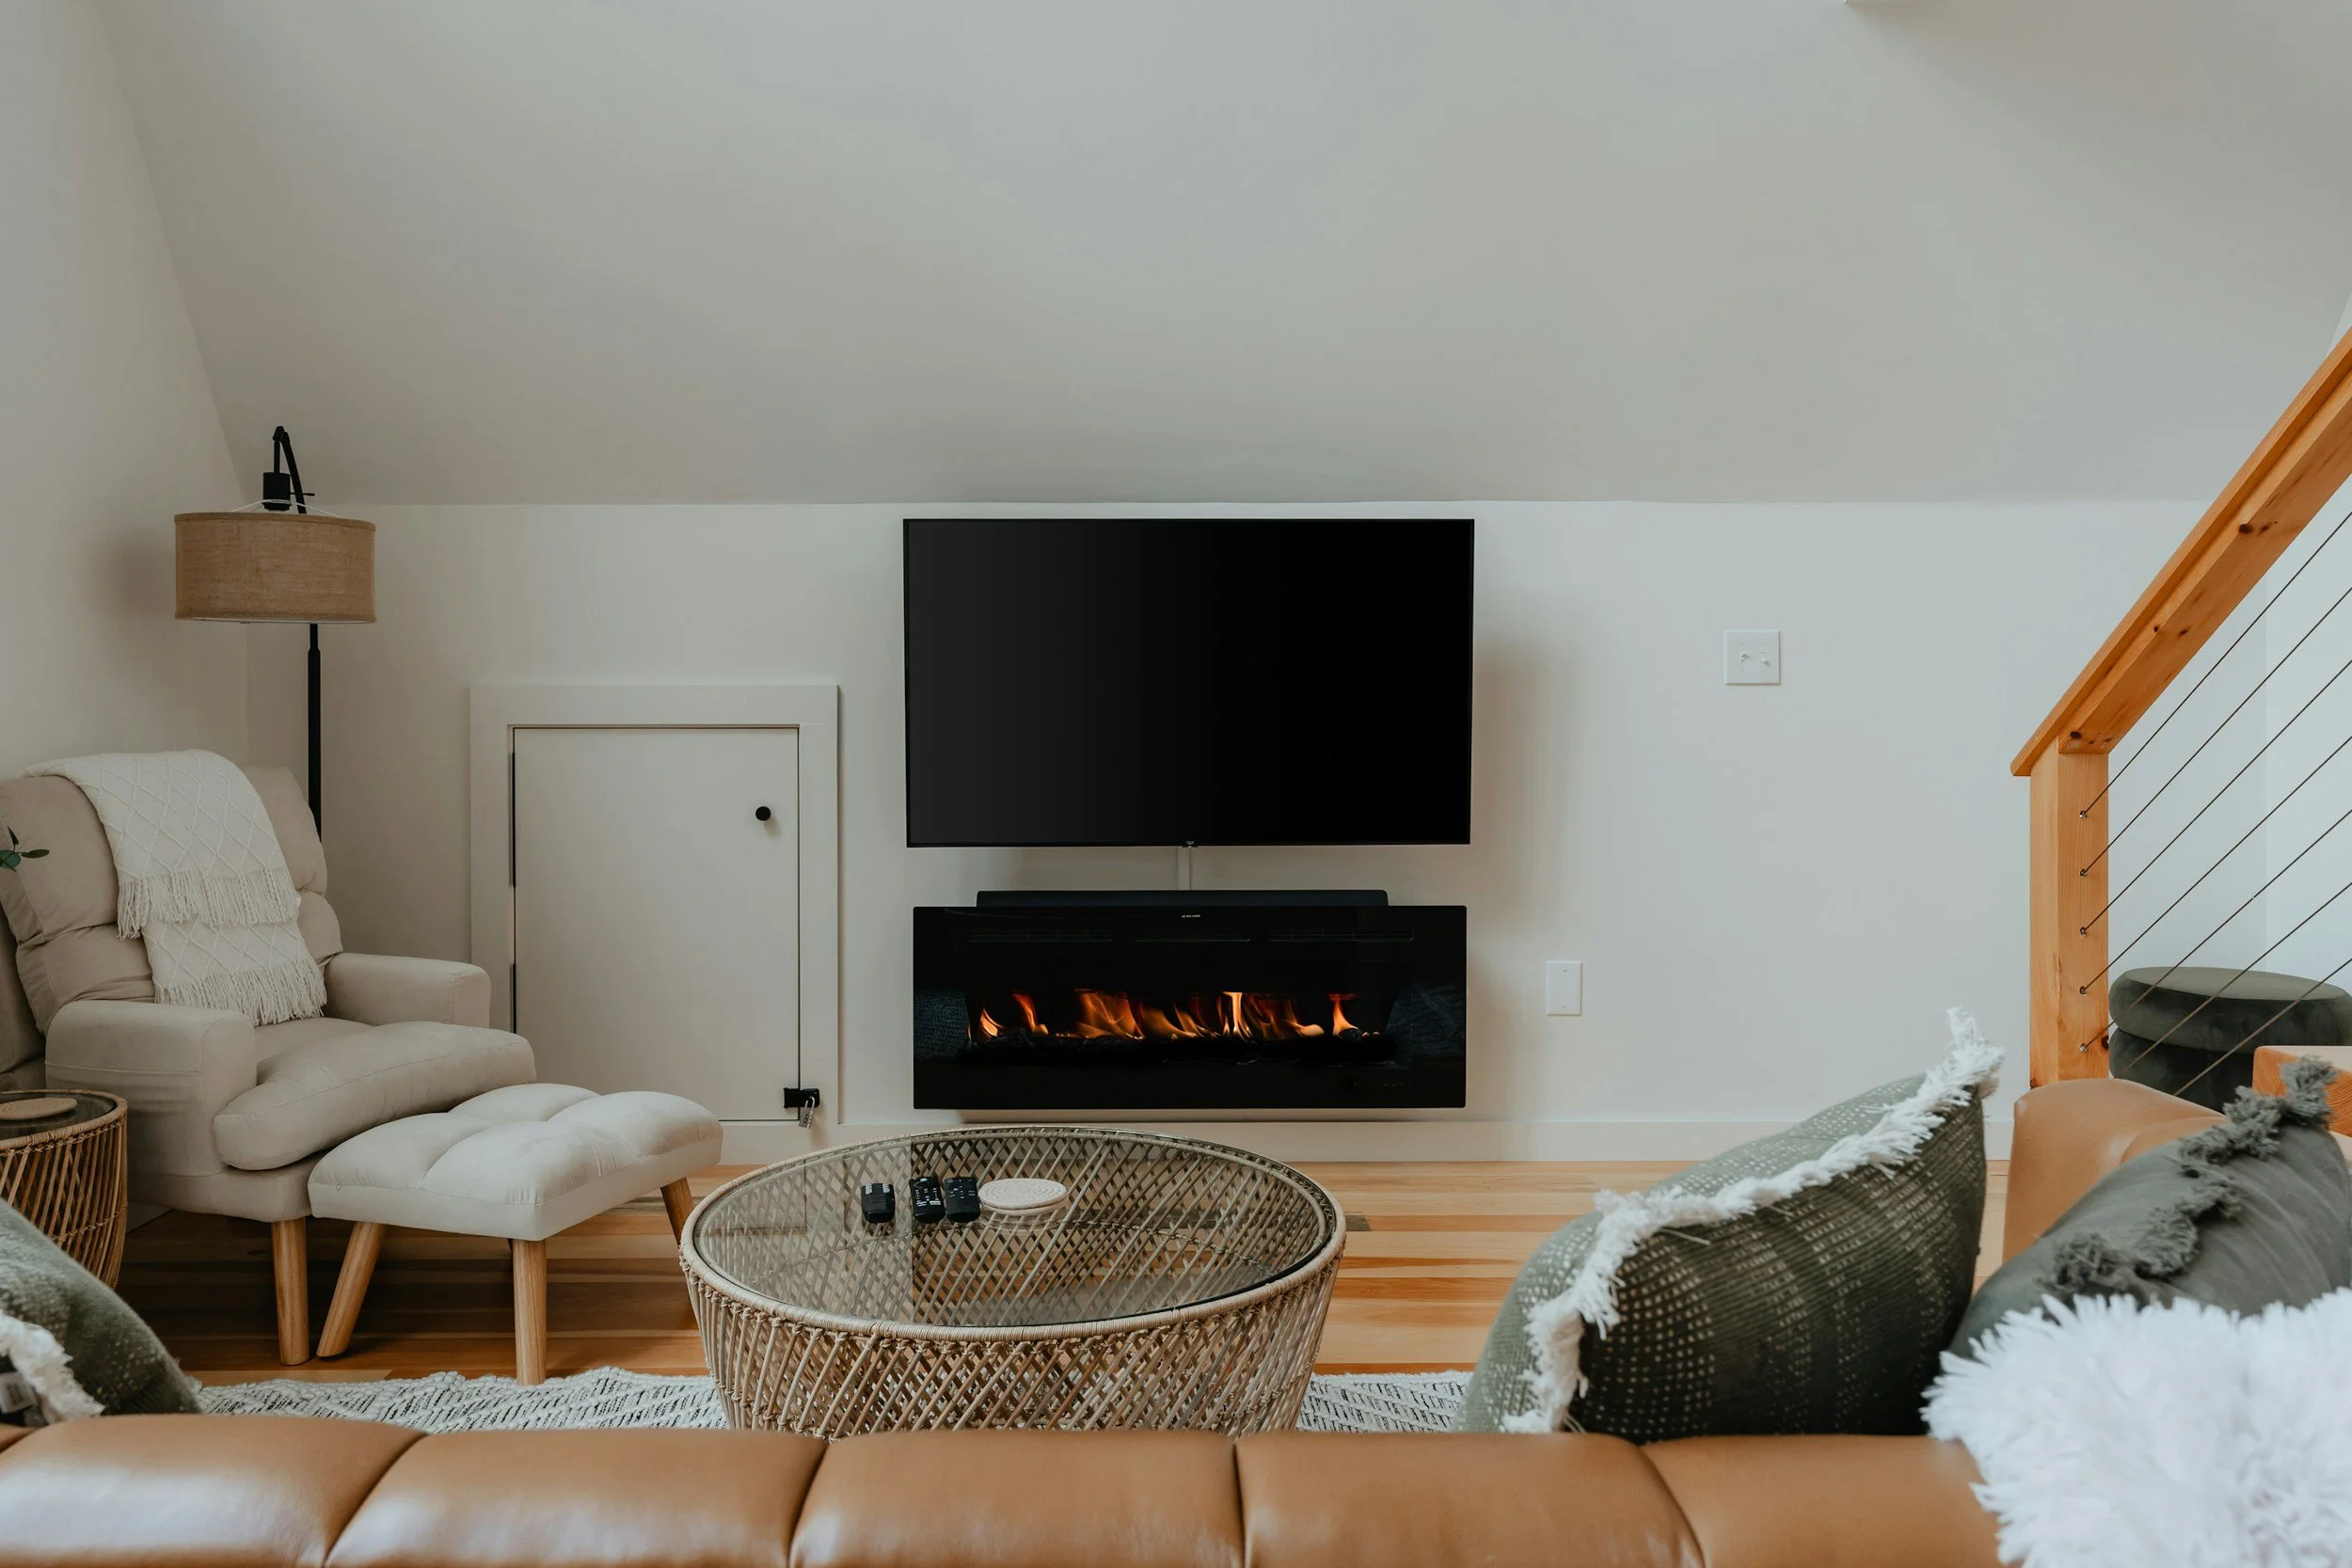
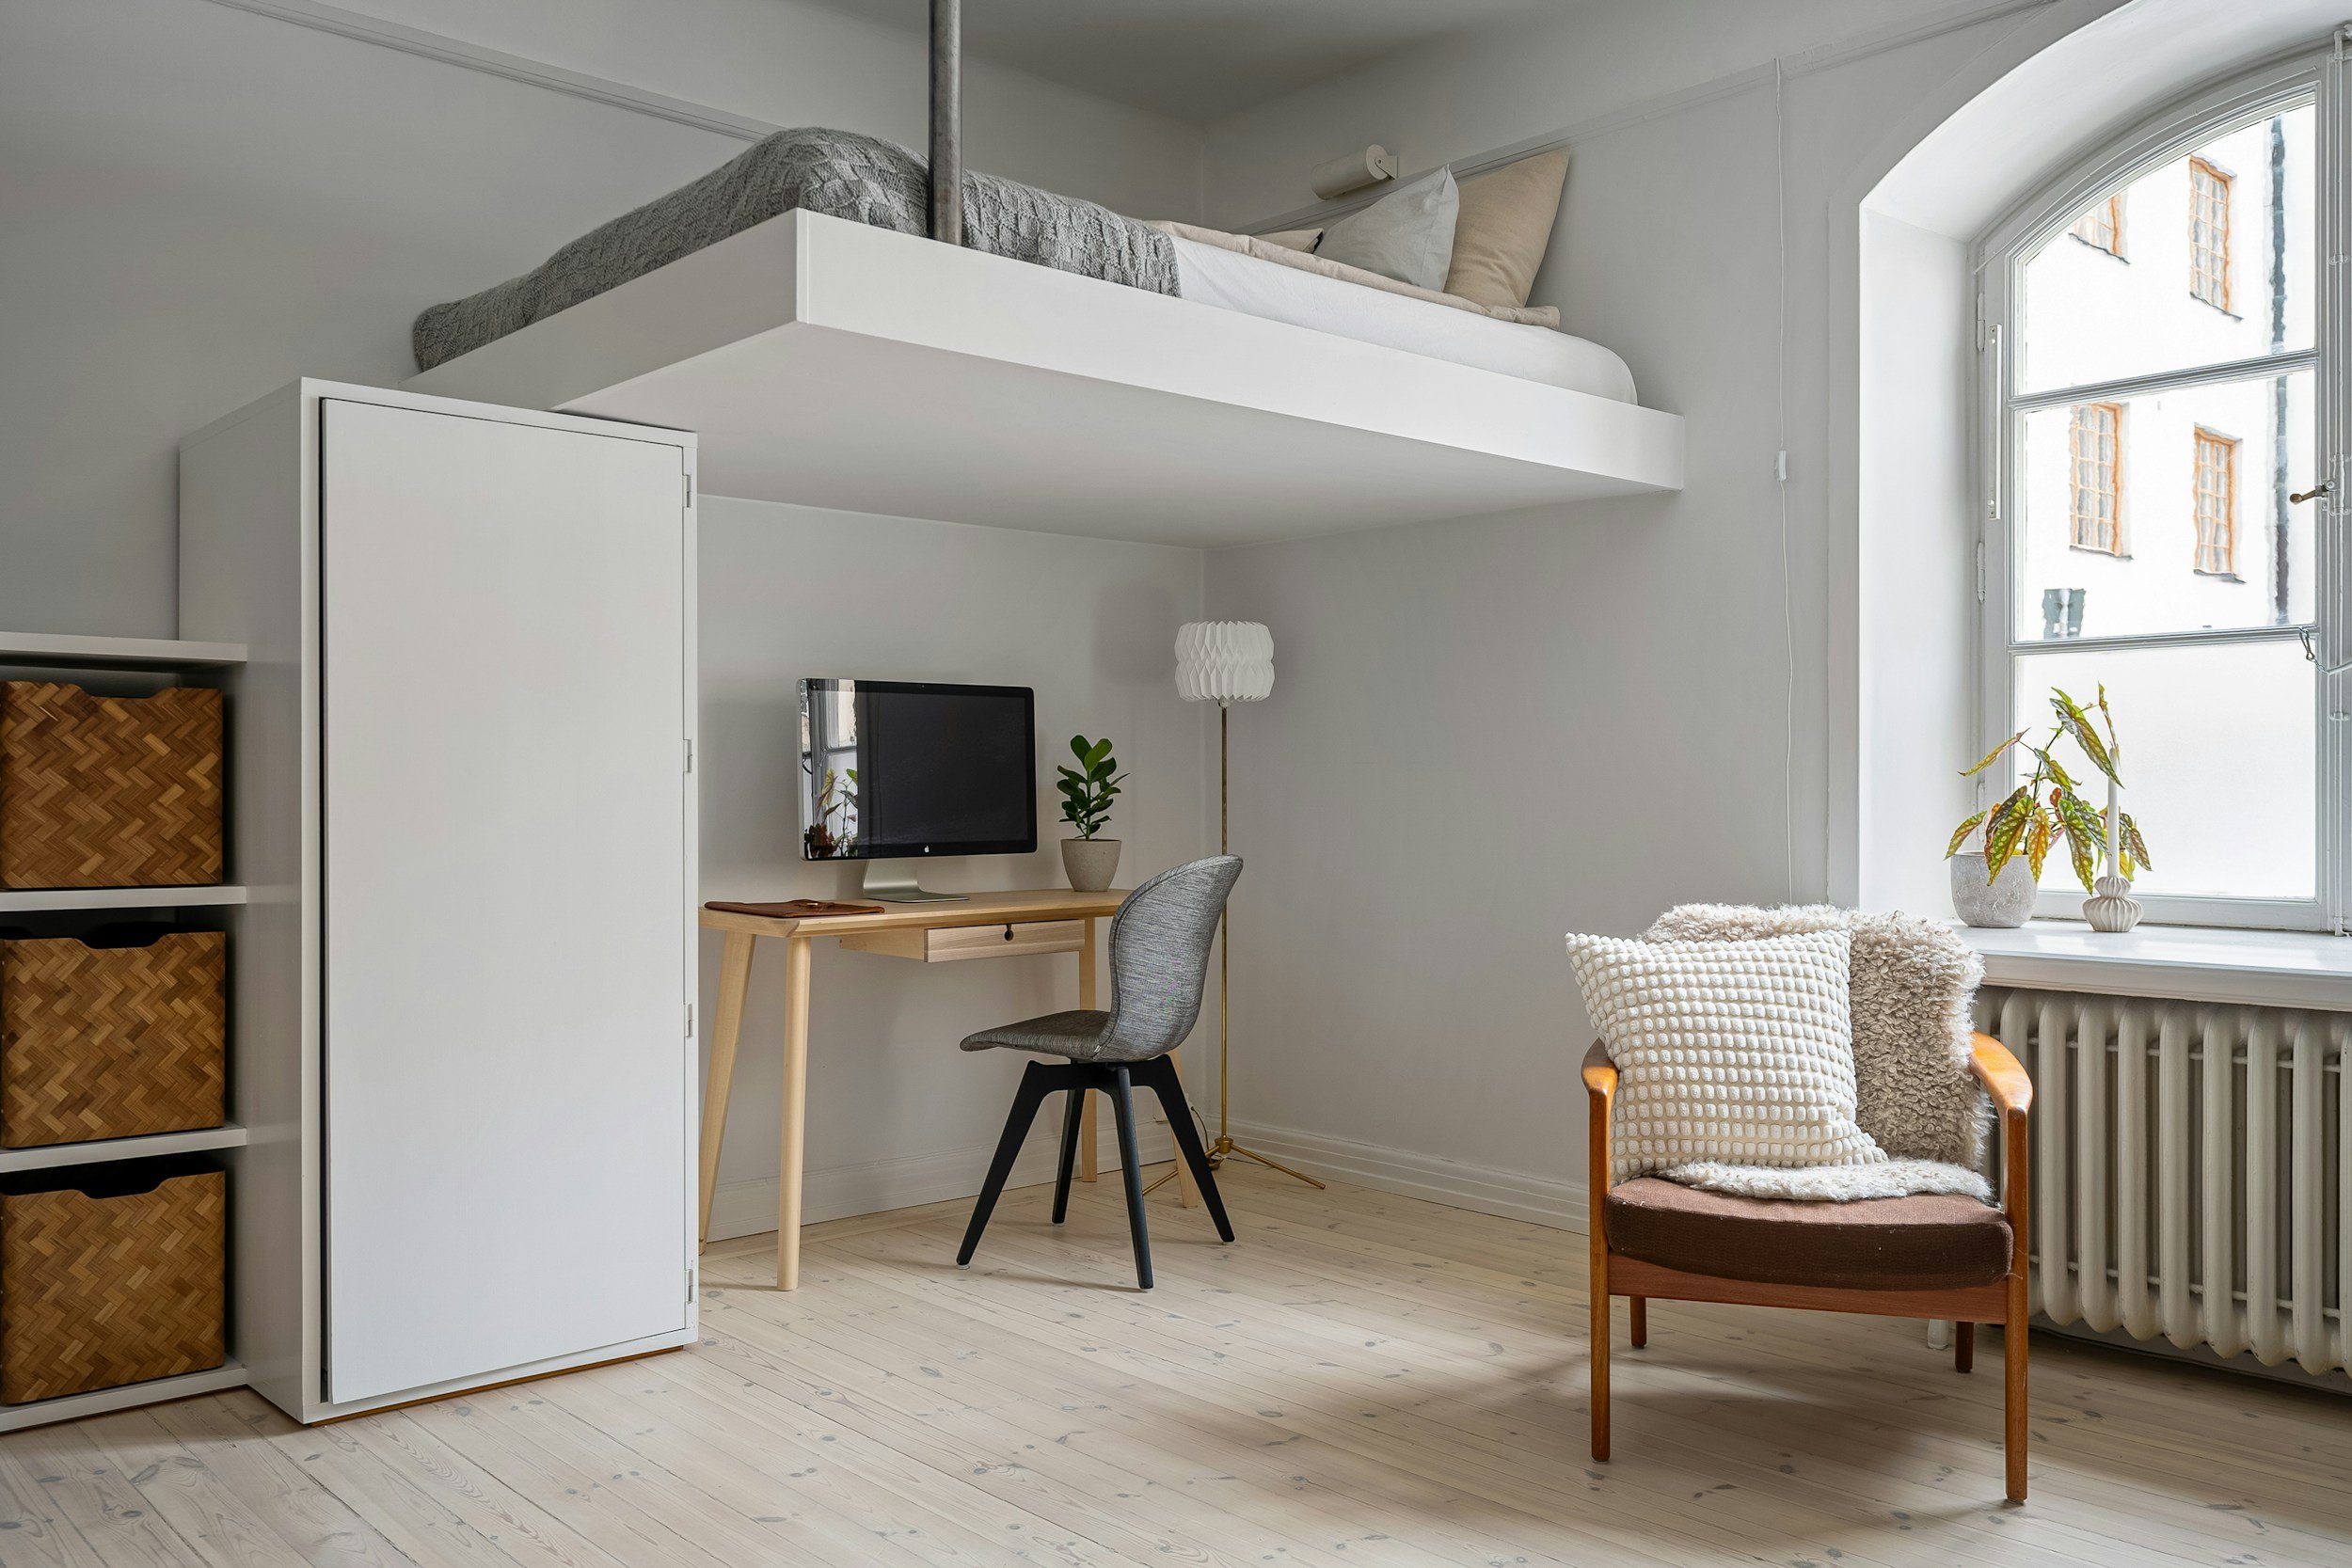
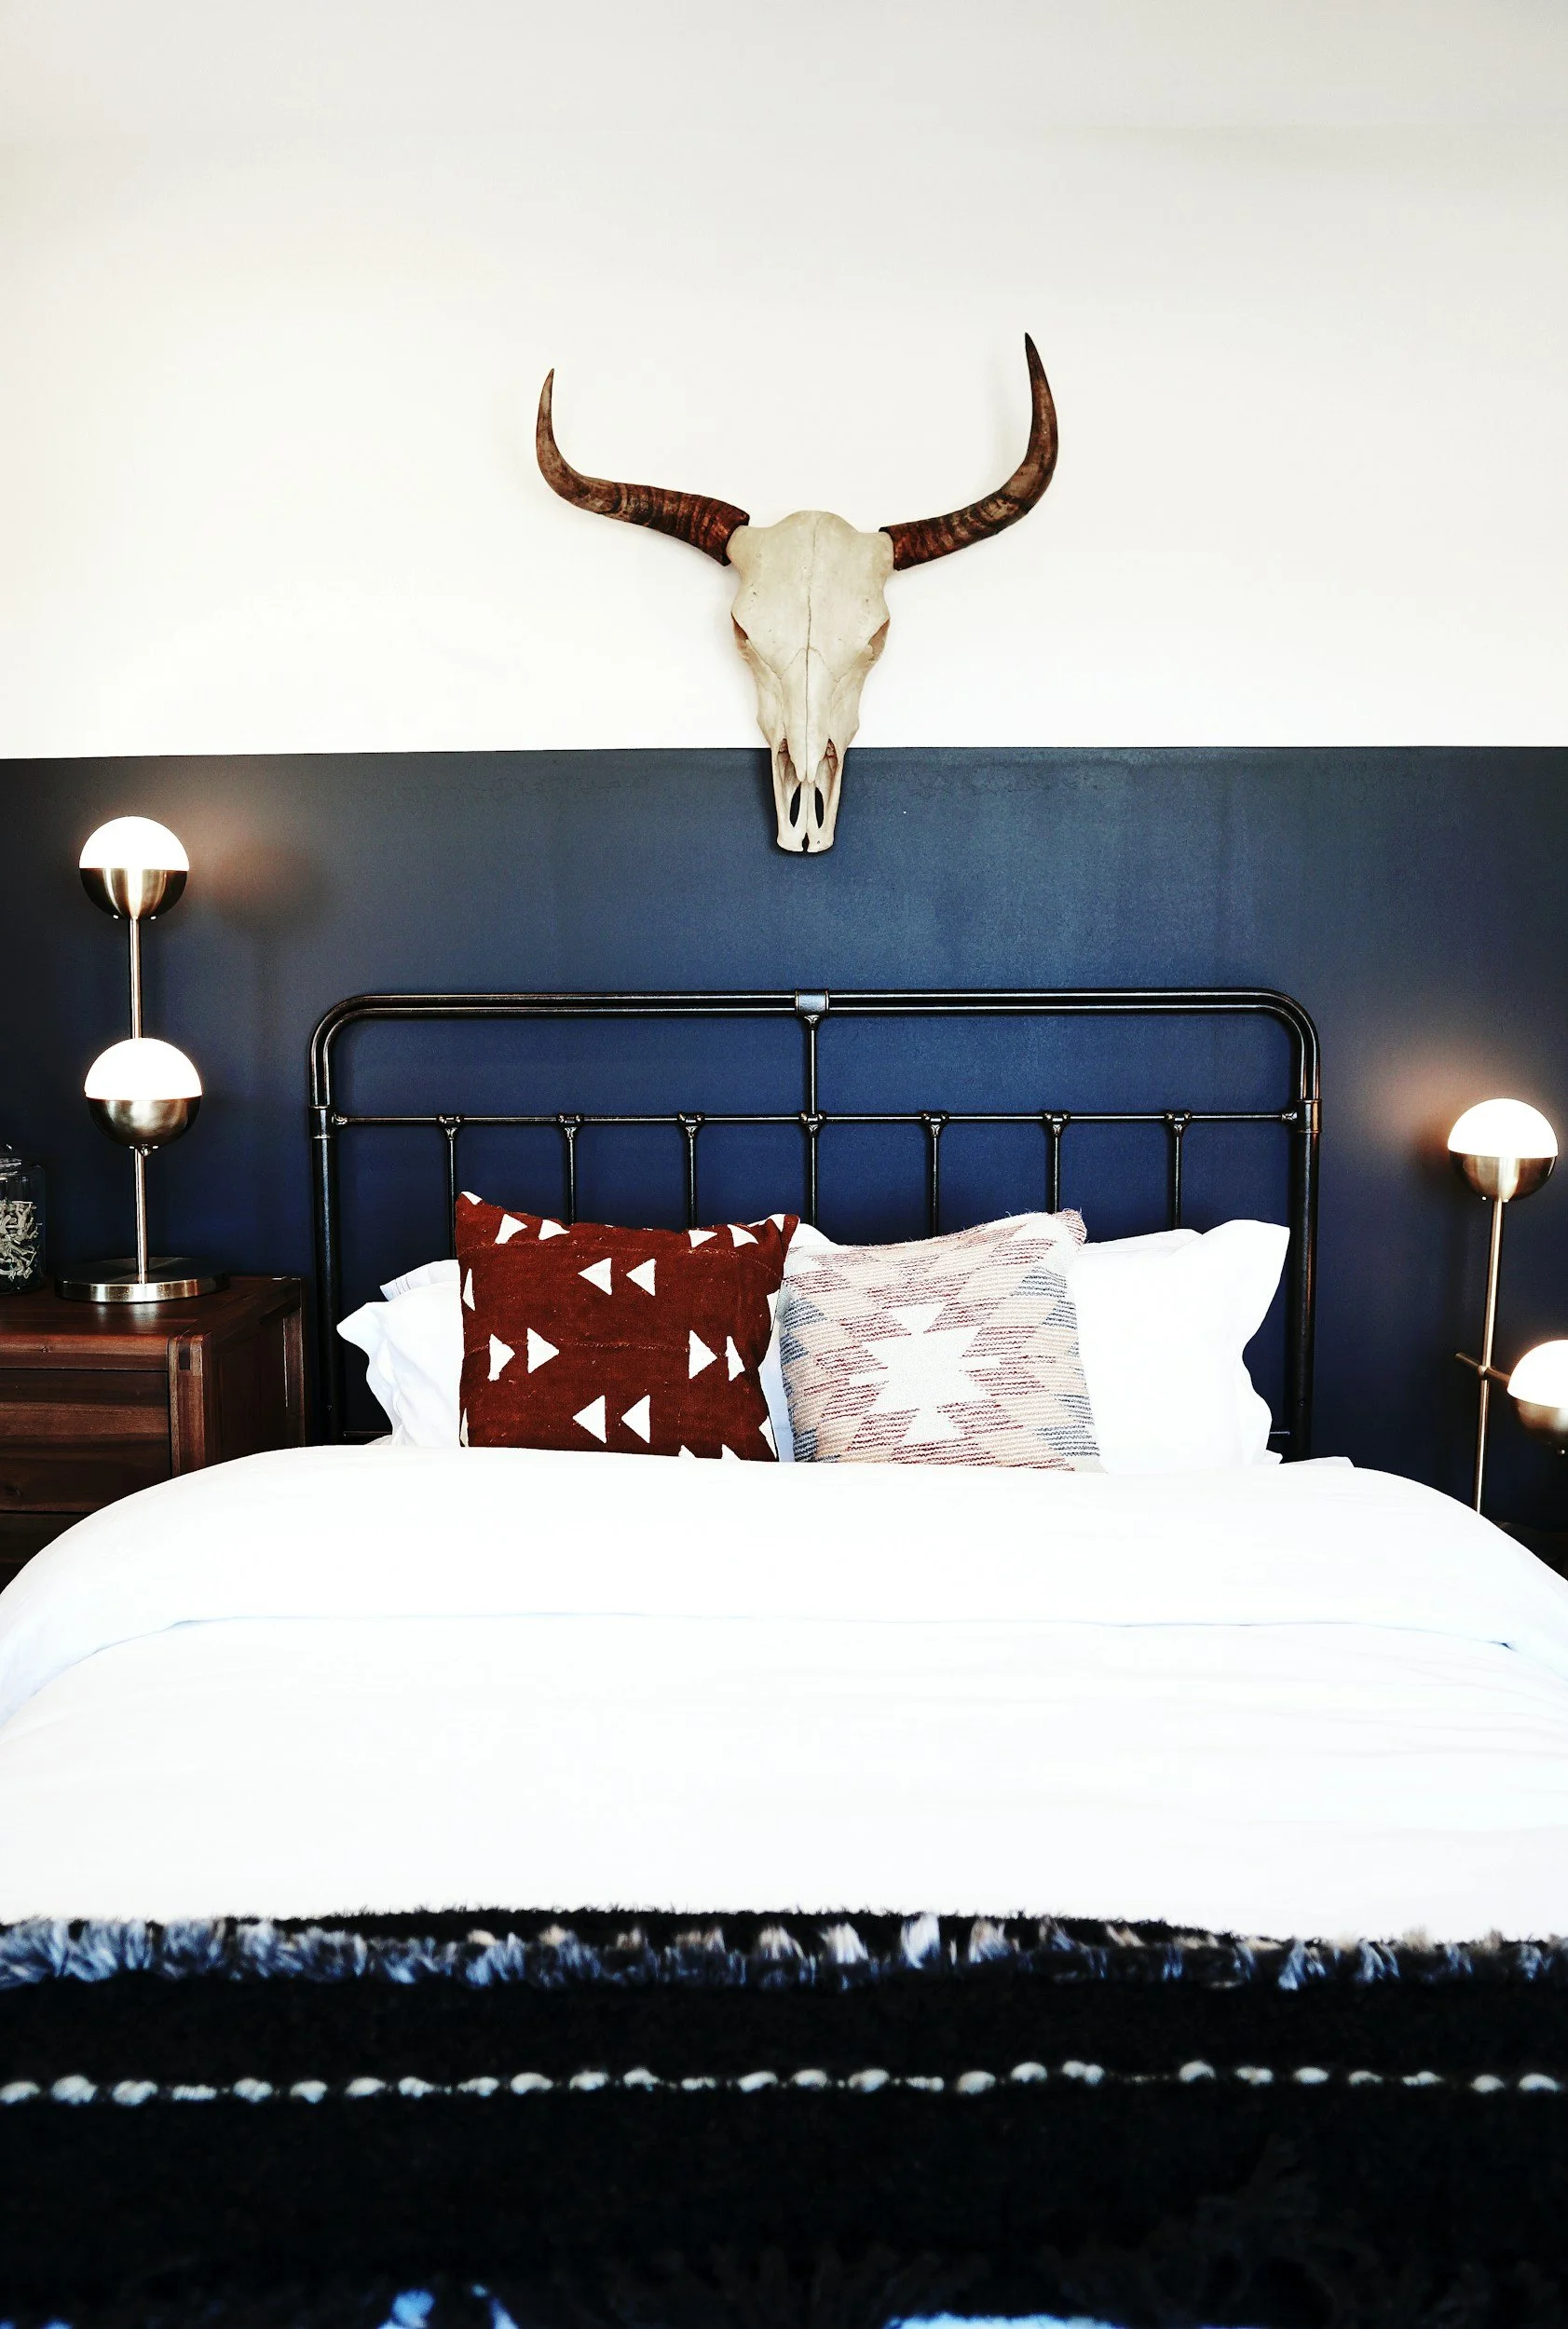
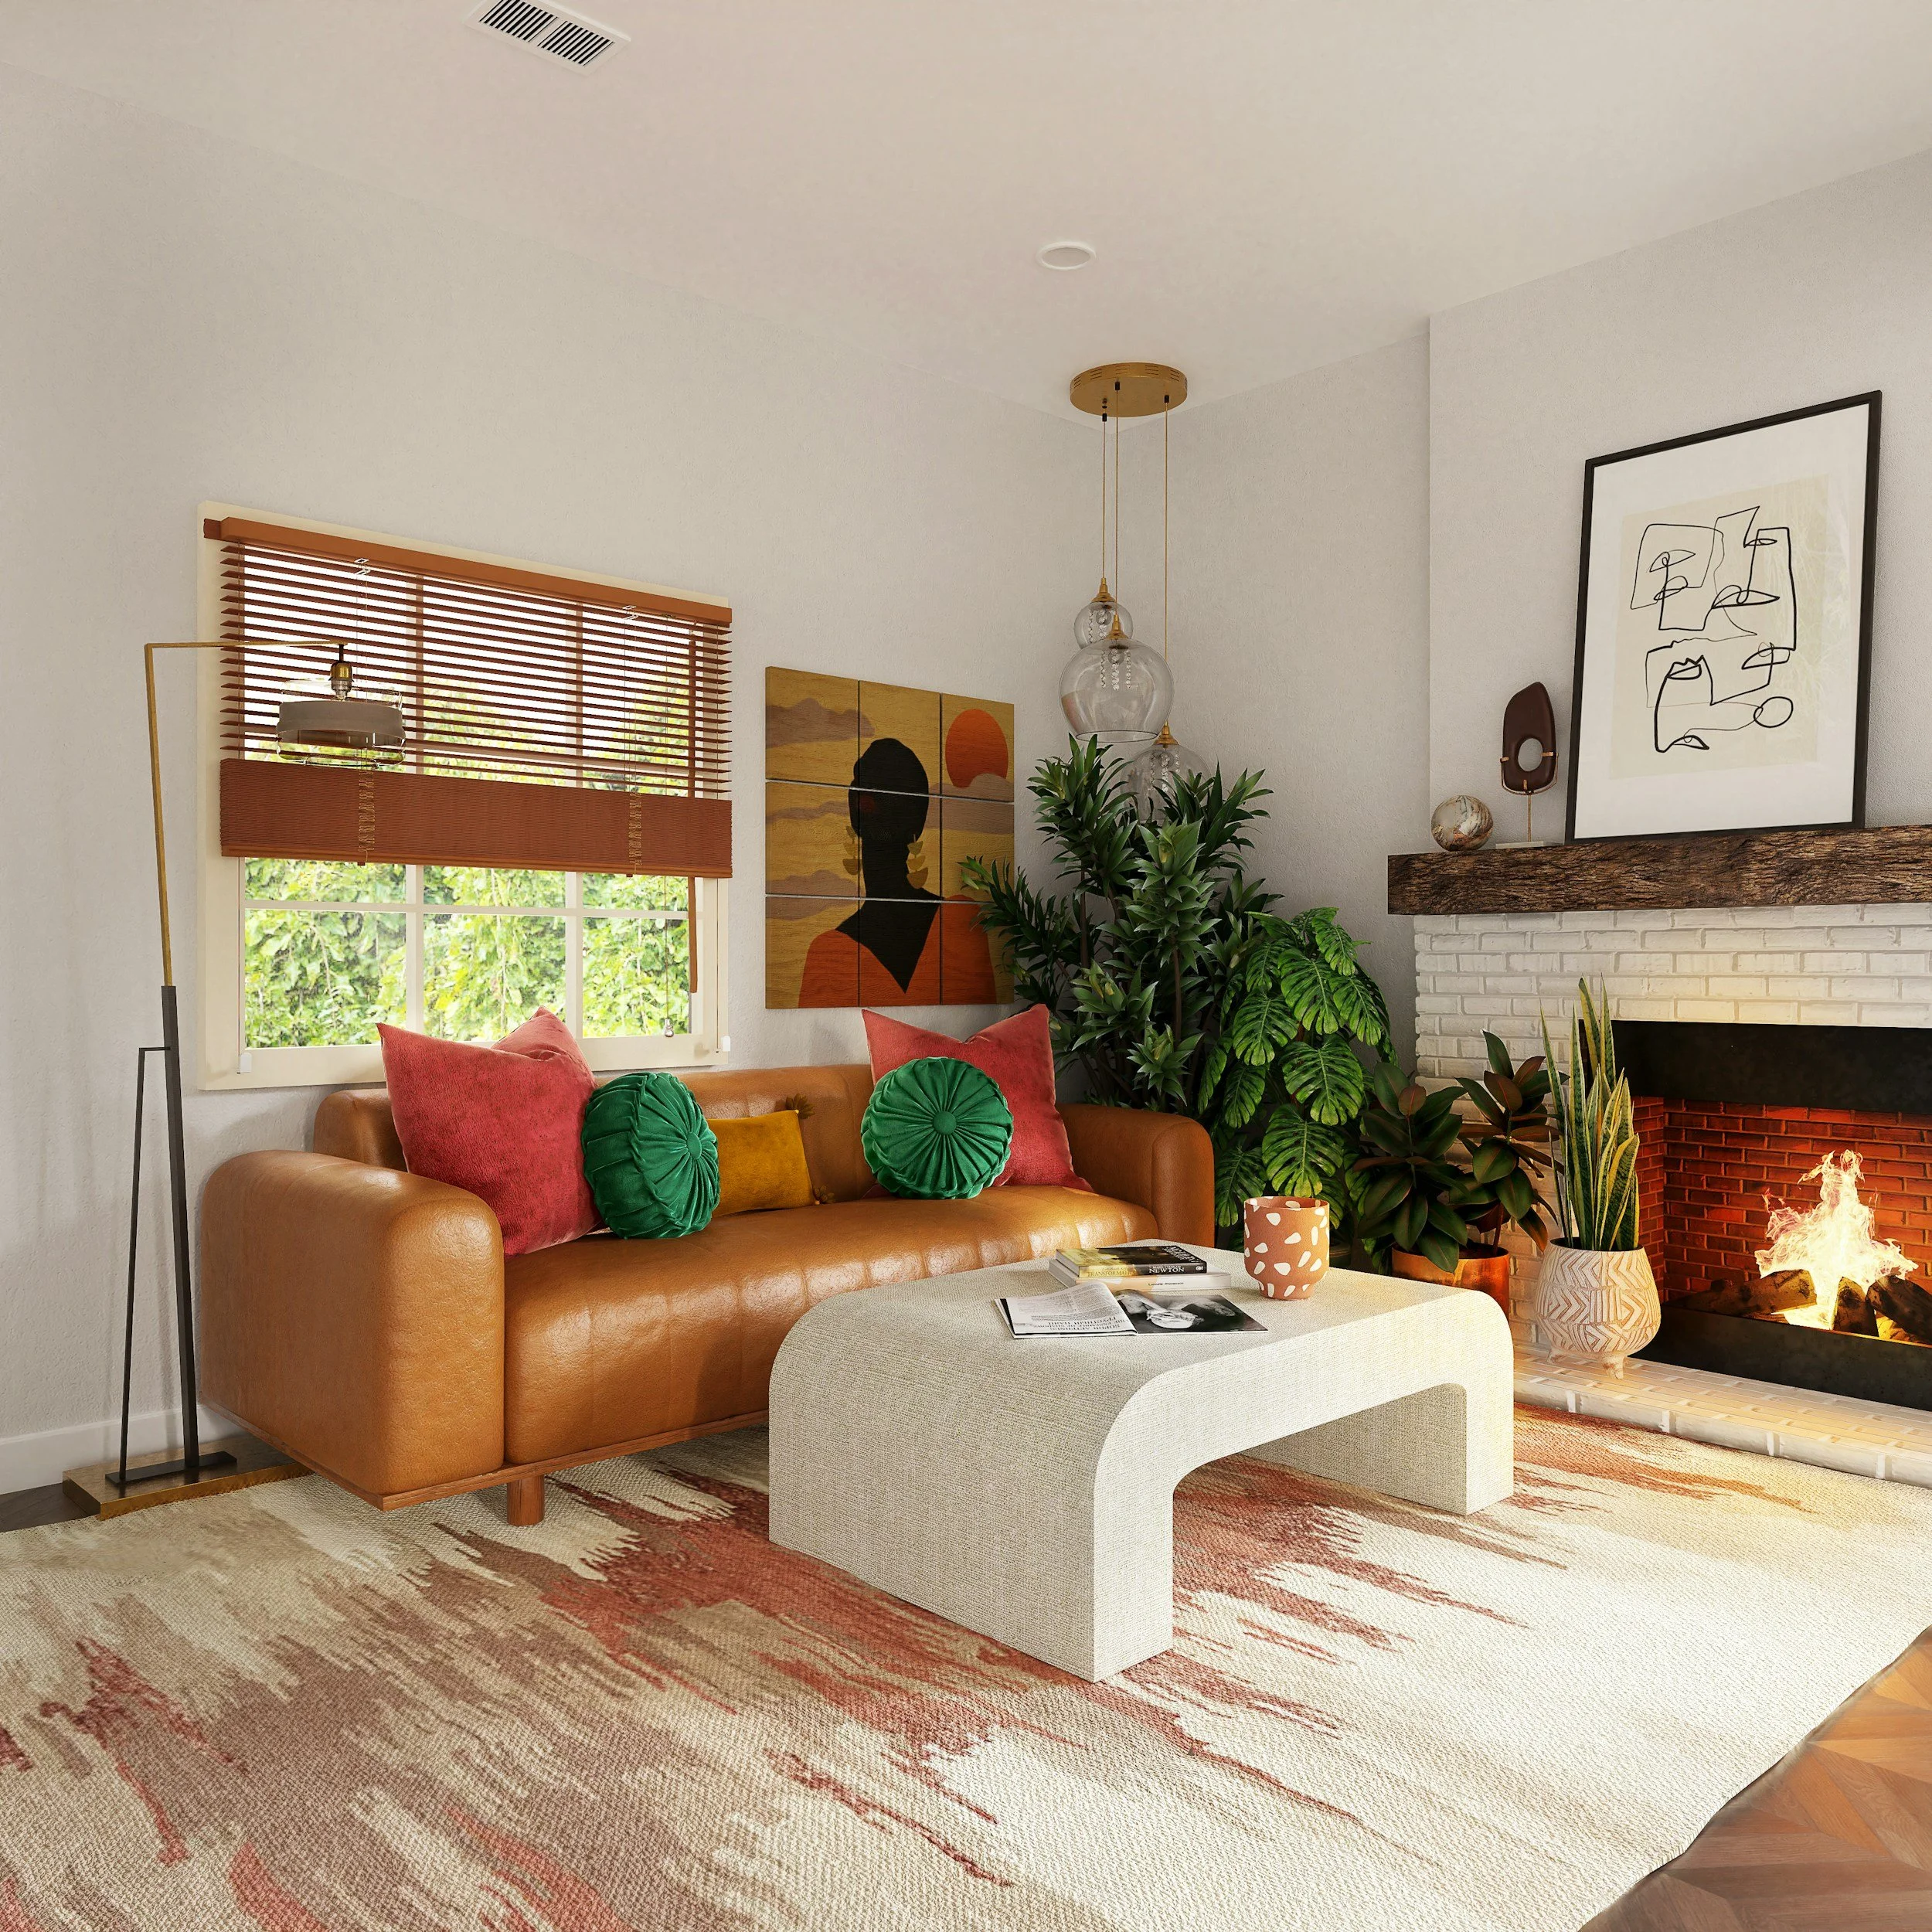
5) Identity wall + color discipline
Build a cohesive visual language (palette, materials). Aim for one signature moment per listing (art mural, fireplace surround, unique headboard wall).
Research shows aesthetics impact willingness to pay; your “memorable moment” is the hook guests remember (and post). (PMC)
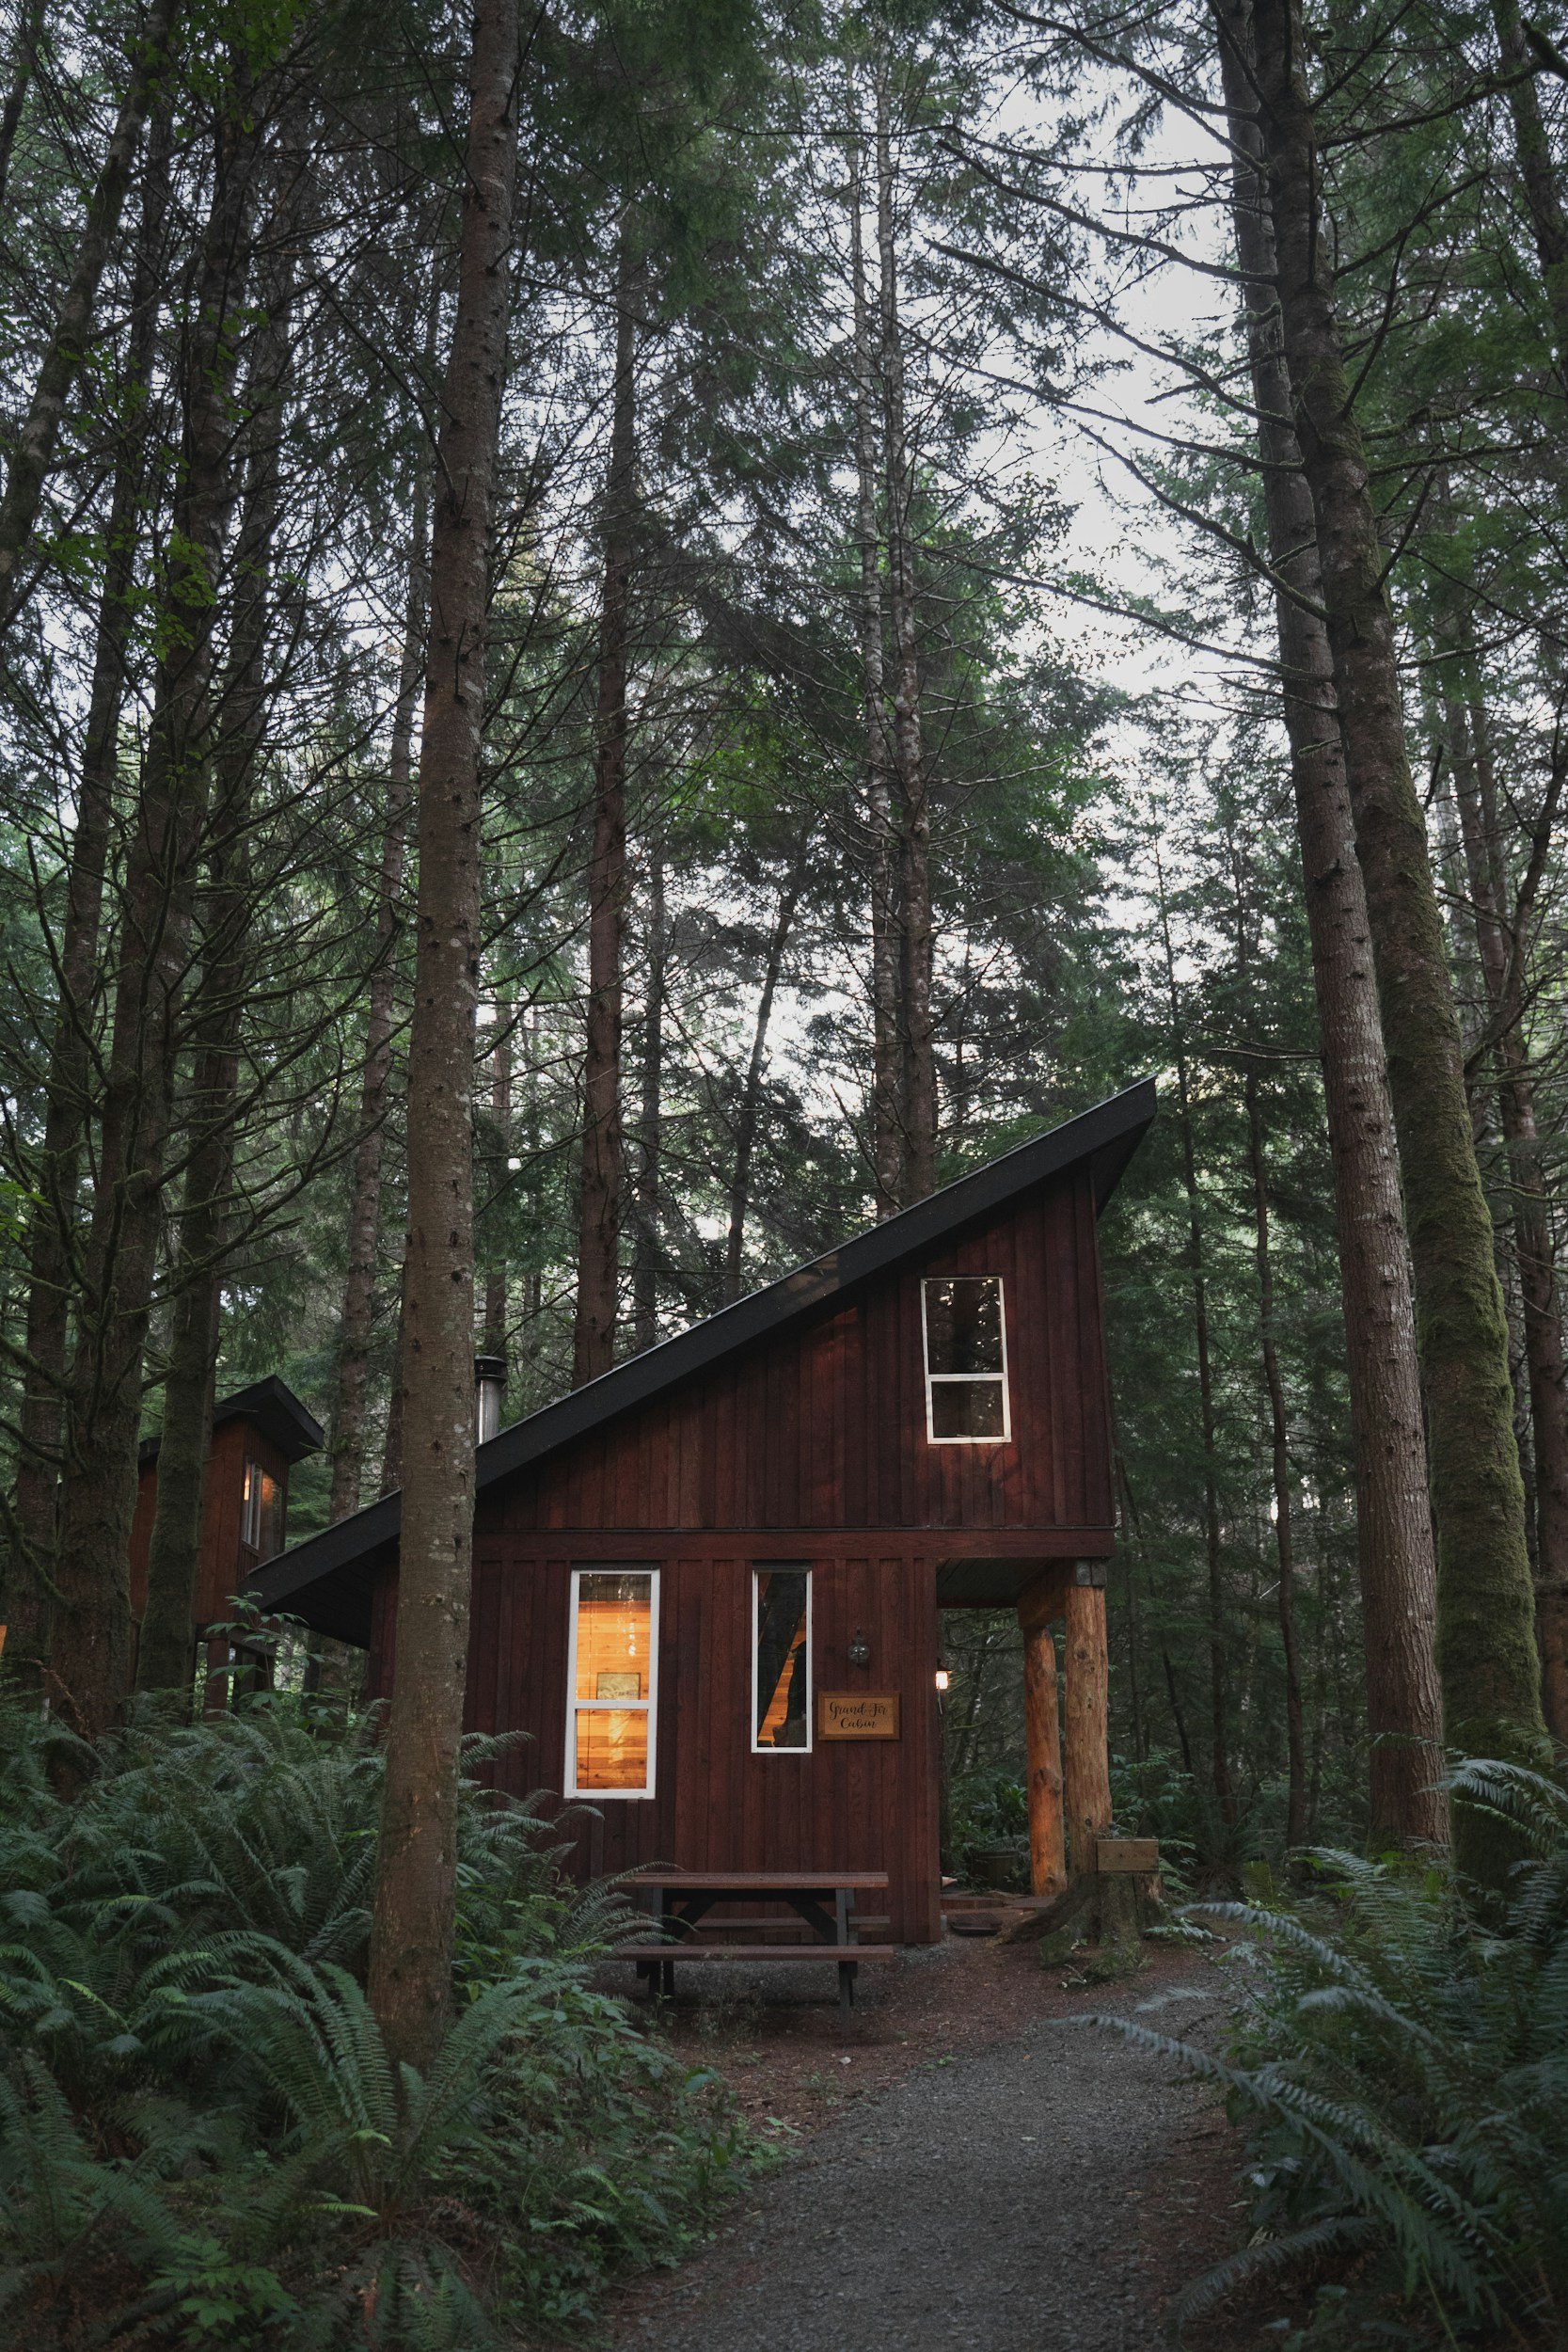
6) Amenities that actually move RevPAR
Choose contextual amenities that match your audience: fire pit, hot tub (with clear maintenance SOPs), quality outdoor seating, smart workspace, or family packs (crib, high chair). AirDNA’s amenity analysis underscores that the right amenities can lift occupancy enough to raise RevPAR even if ADR is similar. (AirDNA)
How design influences each metric (and what to watch)
ADR (pricing power)
Drivers: perceived quality, distinctiveness, review strength.
Design levers: cohesive style, premium textiles, art/storytelling, pro photos.
Proof: Cornell’s 11.2% price-hold example tied to review gains (and design is a prime route to better reviews). (Cornell Nolan)
Watchouts: If you raise rates before visuals and reviews reflect the value, you’ll hit conversion friction.
Occupancy (conversion + calendar health)
Drivers: click-through on cover photos, page engagement, guest confidence, amenity fit, review volume/recency.
Design levers: image sequence that answers questions, functional layouts, practical amenities.
Proof: OTA/industry work links robust visuals to higher click-through/booking intent; amenity studies show occupancy upticks that translate to RevPAR gains. (SAGE Journals)
RevPAR (the outcome you bank)
Drivers: the multiplicative effect of ADR × Occupancy.
Design levers: everything above—because RevPAR is the compounded result of pricing power and conversion.
Proof: Occupancy stabilizing and ADR growth returning post-2024 means well-designed properties see disproportionate upside. (AirDNA)
Implementation playbook (90-day sprint)
Week 1–2: Diagnose & prioritize
Photo audit (5 minutes per listing): Does the first 5 images tell a coherent story? Is the hero image truly scroll-stopping? Where are the gaps (bed count clarity, outdoor promise, workspace proof)?
Review mining: Export reviews, tag recurring issues (lighting, bedding, clutter, instructions).
Amenity fit: List your top 3 guest segments and their top 3 needs; align upgrades accordingly.
Week 3–6: Design & upgrades
Lighting: add dimmers, bedside sconce pairs, under-cabinet LEDs.
Comfort: upgrade mattresses/pillows; replace worn towels and sheets.
Identity moment: budget 1 focal wall or standout element.
Functionality: solve for luggage drop, entry landing, workspace ergonomics, and easy-use kitchen.
Week 7–8: Style + SOPs
Create styling kits (shelf decor, throws, plants) with a photo checklist for turnovers.
Write a 2-page brand guide (palette, finishes, signature props) so your ops team can maintain the look.
Week 9–10: Professional photography
Shoot in the brightest window, with practical styling (no over-staging).
Capture a cover-worthy wide shot and enough detail to build trust. Airbnb itself stresses the role of high-quality images in winning attention and improving engagement. (Airbnb)
Week 11–12: Pricing & listing optimization
Refresh title, first 300 characters, and captions to mirror the design upgrades and amenities that matter to your target guest.
Test ADR in small steps (e.g., +3% weekly for a month) and monitor conversion. The Cornell evidence supports price elasticity when reputation supports it; let your new visuals and early reviews do the talking. (Cornell Nolan)
FAQs owners ask (with straight answers)
“Isn’t this just about better photos?”
Photos are the presentation layer—necessary but not sufficient. If the stay experience doesn’t match the promise, reviews won’t support sustained ADR. Lasting ROI comes from both: upgraded design and photography. Also note: low-quality guest photos in reviews can depress performance ~10%—so make sure the in-person experience is photo-worthy for guests, too. (ScienceDirect)
“What single upgrade returns the most?”
Bedding + lighting. They touch every night, shape reviews, and supercharge photos. In competitive markets, a clean identity wall plus those two upgrades often moves ADR within a month.
“Can amenities really outweigh a slightly lower ADR?”
Yes. If an amenity pulls 2–4 extra nights a month (think: hot tub in a mountain market or workspace for weekday travelers), RevPAR climbs, which is what you bank. AirDNA’s amenity analyses highlight this occupancy-driven RevPAR effect. (AirDNA)
“How soon will I see payback?”
Many owners see lift the next booking cycle once photos update and the first post-refresh reviews land. Our conservative worked example paid back in under two years; if your baseline is dated and your market is visual/experience-led, payback can be faster.
Your action checklist (copy/paste for your team)
Approve a $8k–$15k design refresh budget (lighting, textiles, focal wall, small furniture edits, styling).
Schedule pro photos after upgrades (and whenever you add a high-impact amenity). (Airbnb)
Implement lighting layers and bedding standards (with a SKU sheet for reorders).
Add one contextual amenity aligned to your top guest segment. (AirDNA)
Update listing copy + first 5 photos to tell a clear story of value.
Measure before/after: track ADR, occupancy, RevPAR over the following 90 days.
Reinforce with in-stay details (labels, guides, checklists) that prevent friction and earn five-star reviews—your gateway to price elasticity. (Cornell Nolan)
Key sources (so you don’t have to take my word for it)
Cornell Center for Hospitality Research (Chris K. Anderson): 1-point review lift → ~11% price flexibility without losing share; links between online reputation, ADR, occupancy, RevPAR. Essential reading on how guest perception monetizes. (Cornell Nolan)
AirDNA market outlooks & amenity insights: STR occupancy and ADR stability into 2025; amenity-driven RevPAR lifts (e.g., pool properties gaining via occupancy). (AirDNA)
Photography & visuals research: Airbnb emphasizes high-quality photos as a booking driver; experimental work shows cover photo framing impacts booking intent; low-quality guest photos in reviews can depress performance. (Airbnb)
Aesthetics & servicescape studies: Evidence that guests pay premiums for well-designed environments. (MDPI)
The bottom line
Design is not decoration. It’s an income strategy. When you upgrade interiors with intention—and then communicate that value with on-brand photos and copy—you unlock pricing power (ADR), make more nights convert (occupancy), and compound the result into RevPAR. The data backs it up. The math works. And with a smart 90-day plan, you can see the lift within your next booking cycle.
If you’re ready to turn “pretty” into profit, let’s make a plan.

If you are looking to transform your space, interested in Asheville real estate, or just want to say hi, I'd love to hear from you!
Not quite ready for a full on design project? Take a step towards transformation with the 30 Minute Home Refresh Guide.
READ MORE
Book a Call


